One sample, flexible views
The main Analytics filter controls which matches are included across the page. Use it to focus on a specific period, competition, venue, opponent, match type, outcome or selected matches. Individual sections also provide their own display and statistic controls.
Where available, display modes let you switch between raw totals and normalized views such as per match or time-based values.
Match & Progress
This panel combines match-level analysis with progress tracking. The Match Statistics table replaces the older card-based statistics view and groups important team values into clear sections.
The table follows the active Analytics sample, so filters can be used to analyse selected matches or periods. Progress tools remain available for following performance over time and working with defined targets.
Player & Lineup
The Player & Lineup panel has been substantially rebuilt around player comparison and context.
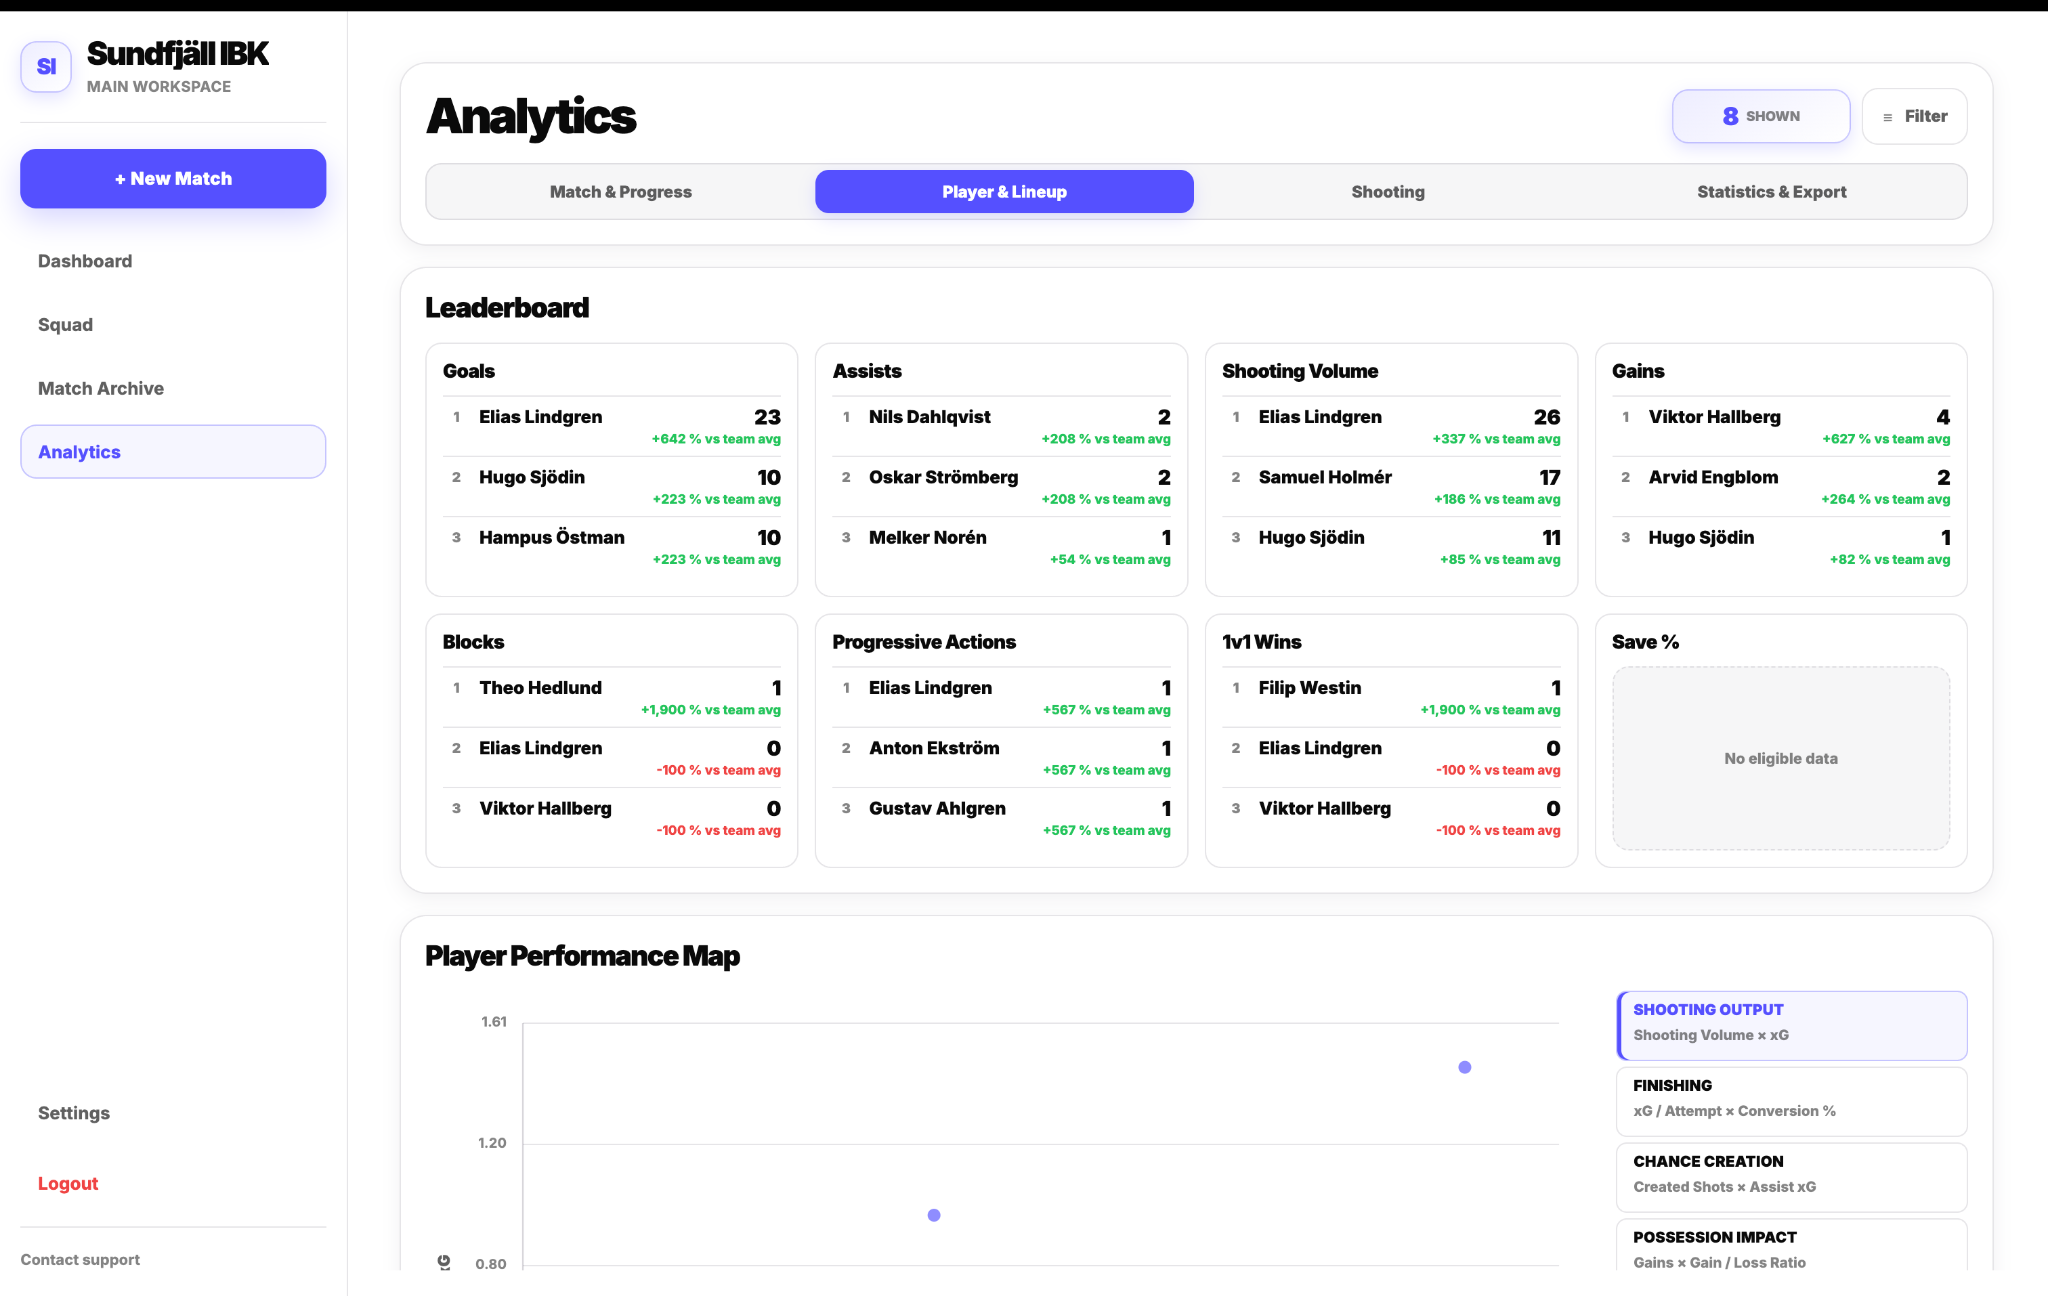
Leaderboard
The Leaderboard shows the top three players for key statistics such as goals, assists, shooting volume, gains, blocks, progressive actions, 1v1 wins and goalkeeper save percentage when eligible data is available. Each card also provides context against the team average.
Player Performance Map
The Player Performance Map plots players across two dimensions. Ready-made presets provide different perspectives on performance:
- Shooting Output
- Finishing
- Chance Creation
- Possession Impact
- Progression
- 1v1 Impact
- Shot Blocking
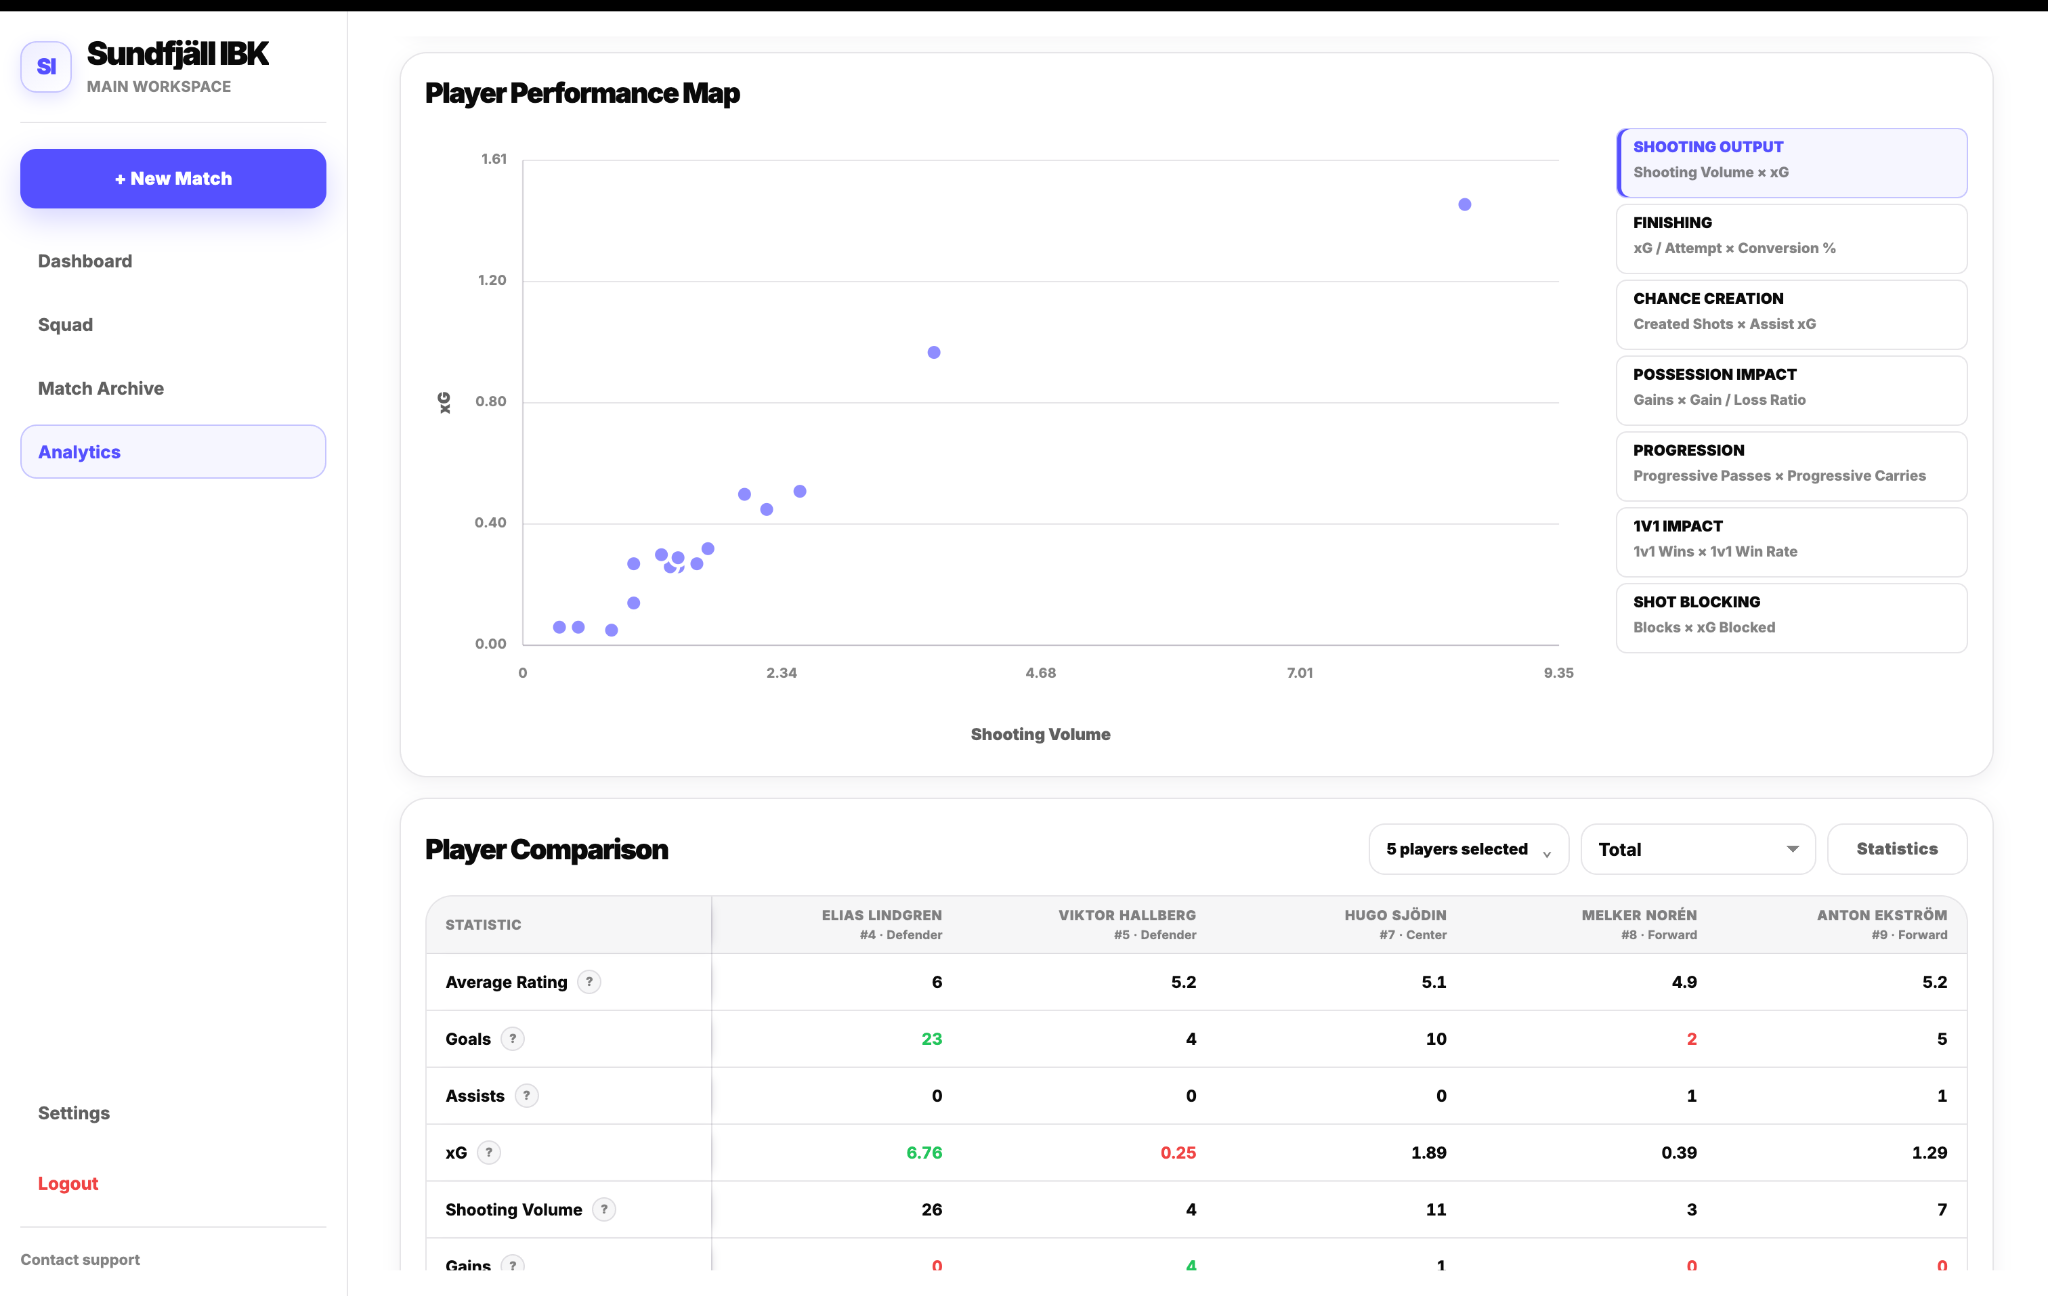
Player Comparison
Select up to five players and compare them side by side. Choose the statistics shown so the comparison matches the question you are analysing.
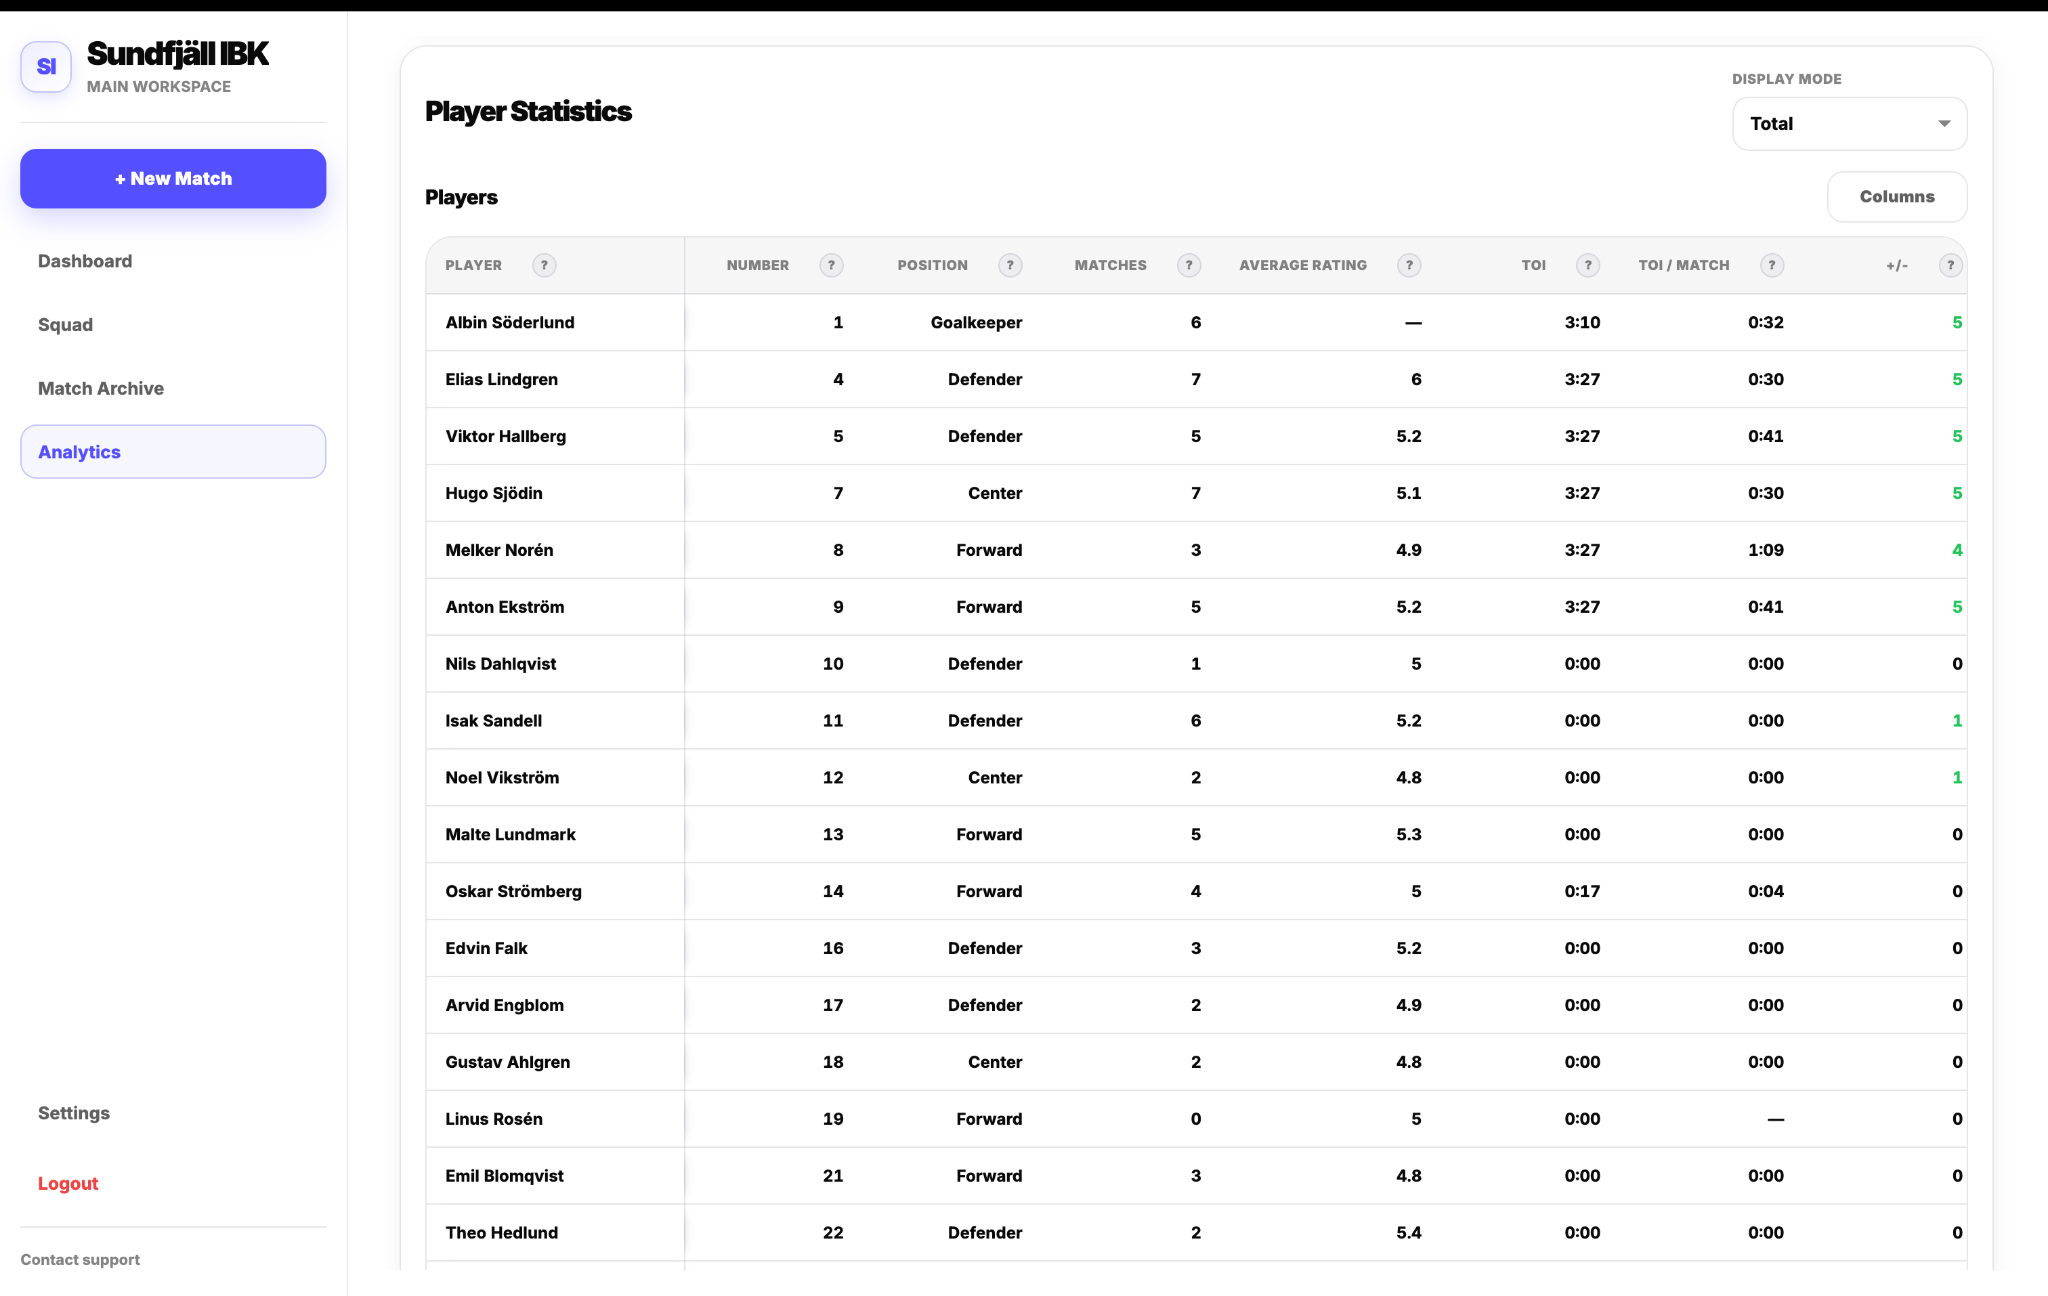
Player Statistics
The Player Statistics table provides the detailed numerical view. Field players and goalkeepers have dedicated statistics, and the table can be filtered and configured to show the values relevant to your current analysis.
Shooting
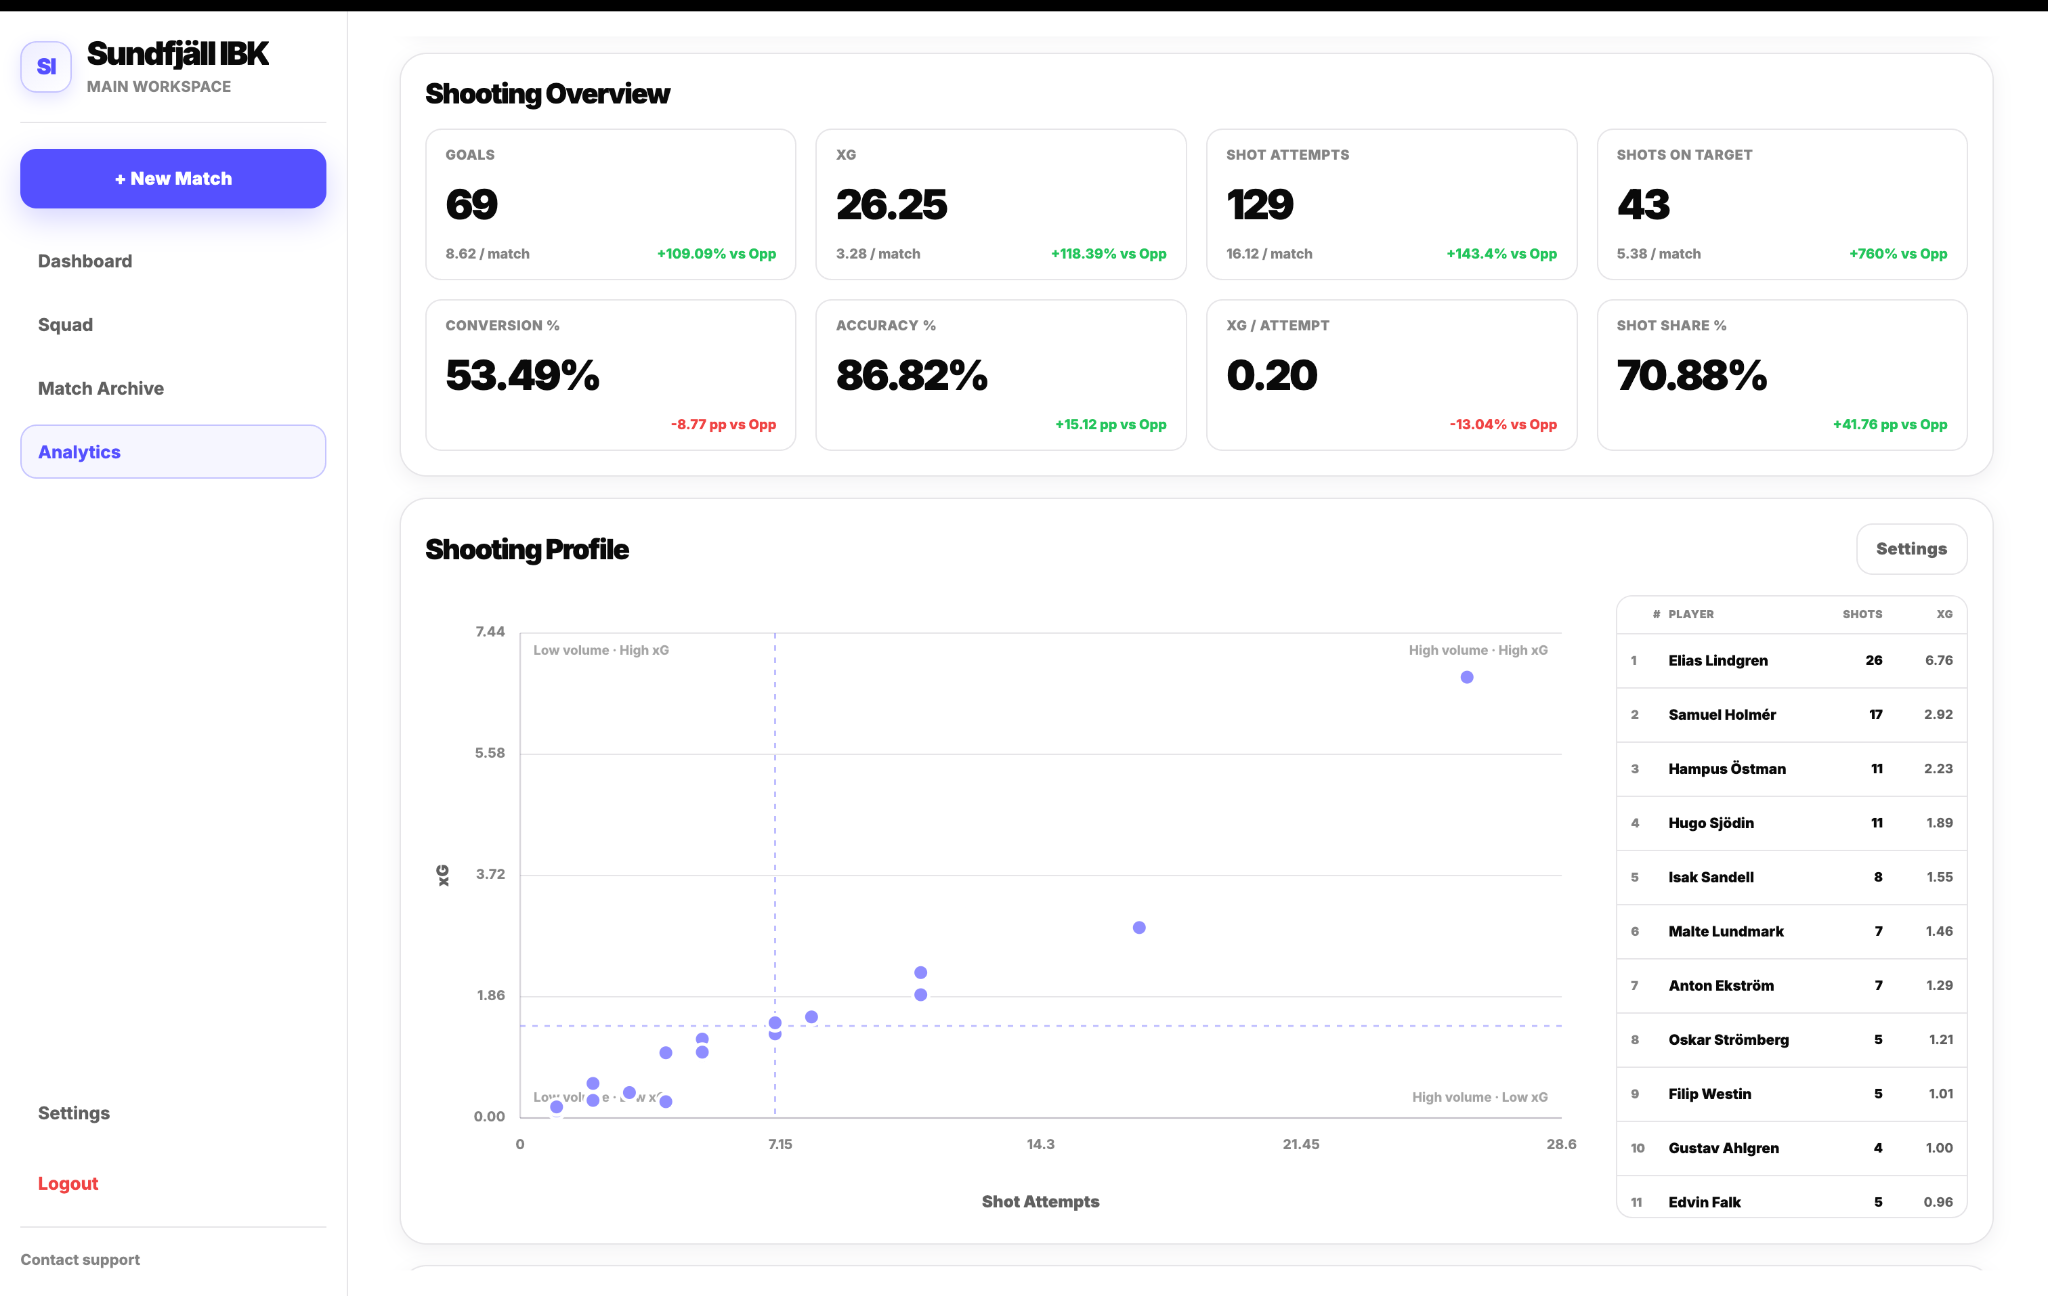
Shooting is a completely new dedicated panel for understanding shot creation, quality, finishing and location.
Shooting Overview
The overview surfaces the most important shooting metrics and adds opposition comparison so the team's output can be read in context.
Shooting Profile
The Shooting Profile positions players by shot volume and chance quality, creating four simple areas from low/high volume and low/high xG.
xG Performance Map
The xG Performance Map highlights which players are scoring above or below the output suggested by their expected goals, helping separate chance generation from finishing results.
Corsi Overview & Shooting Timeline
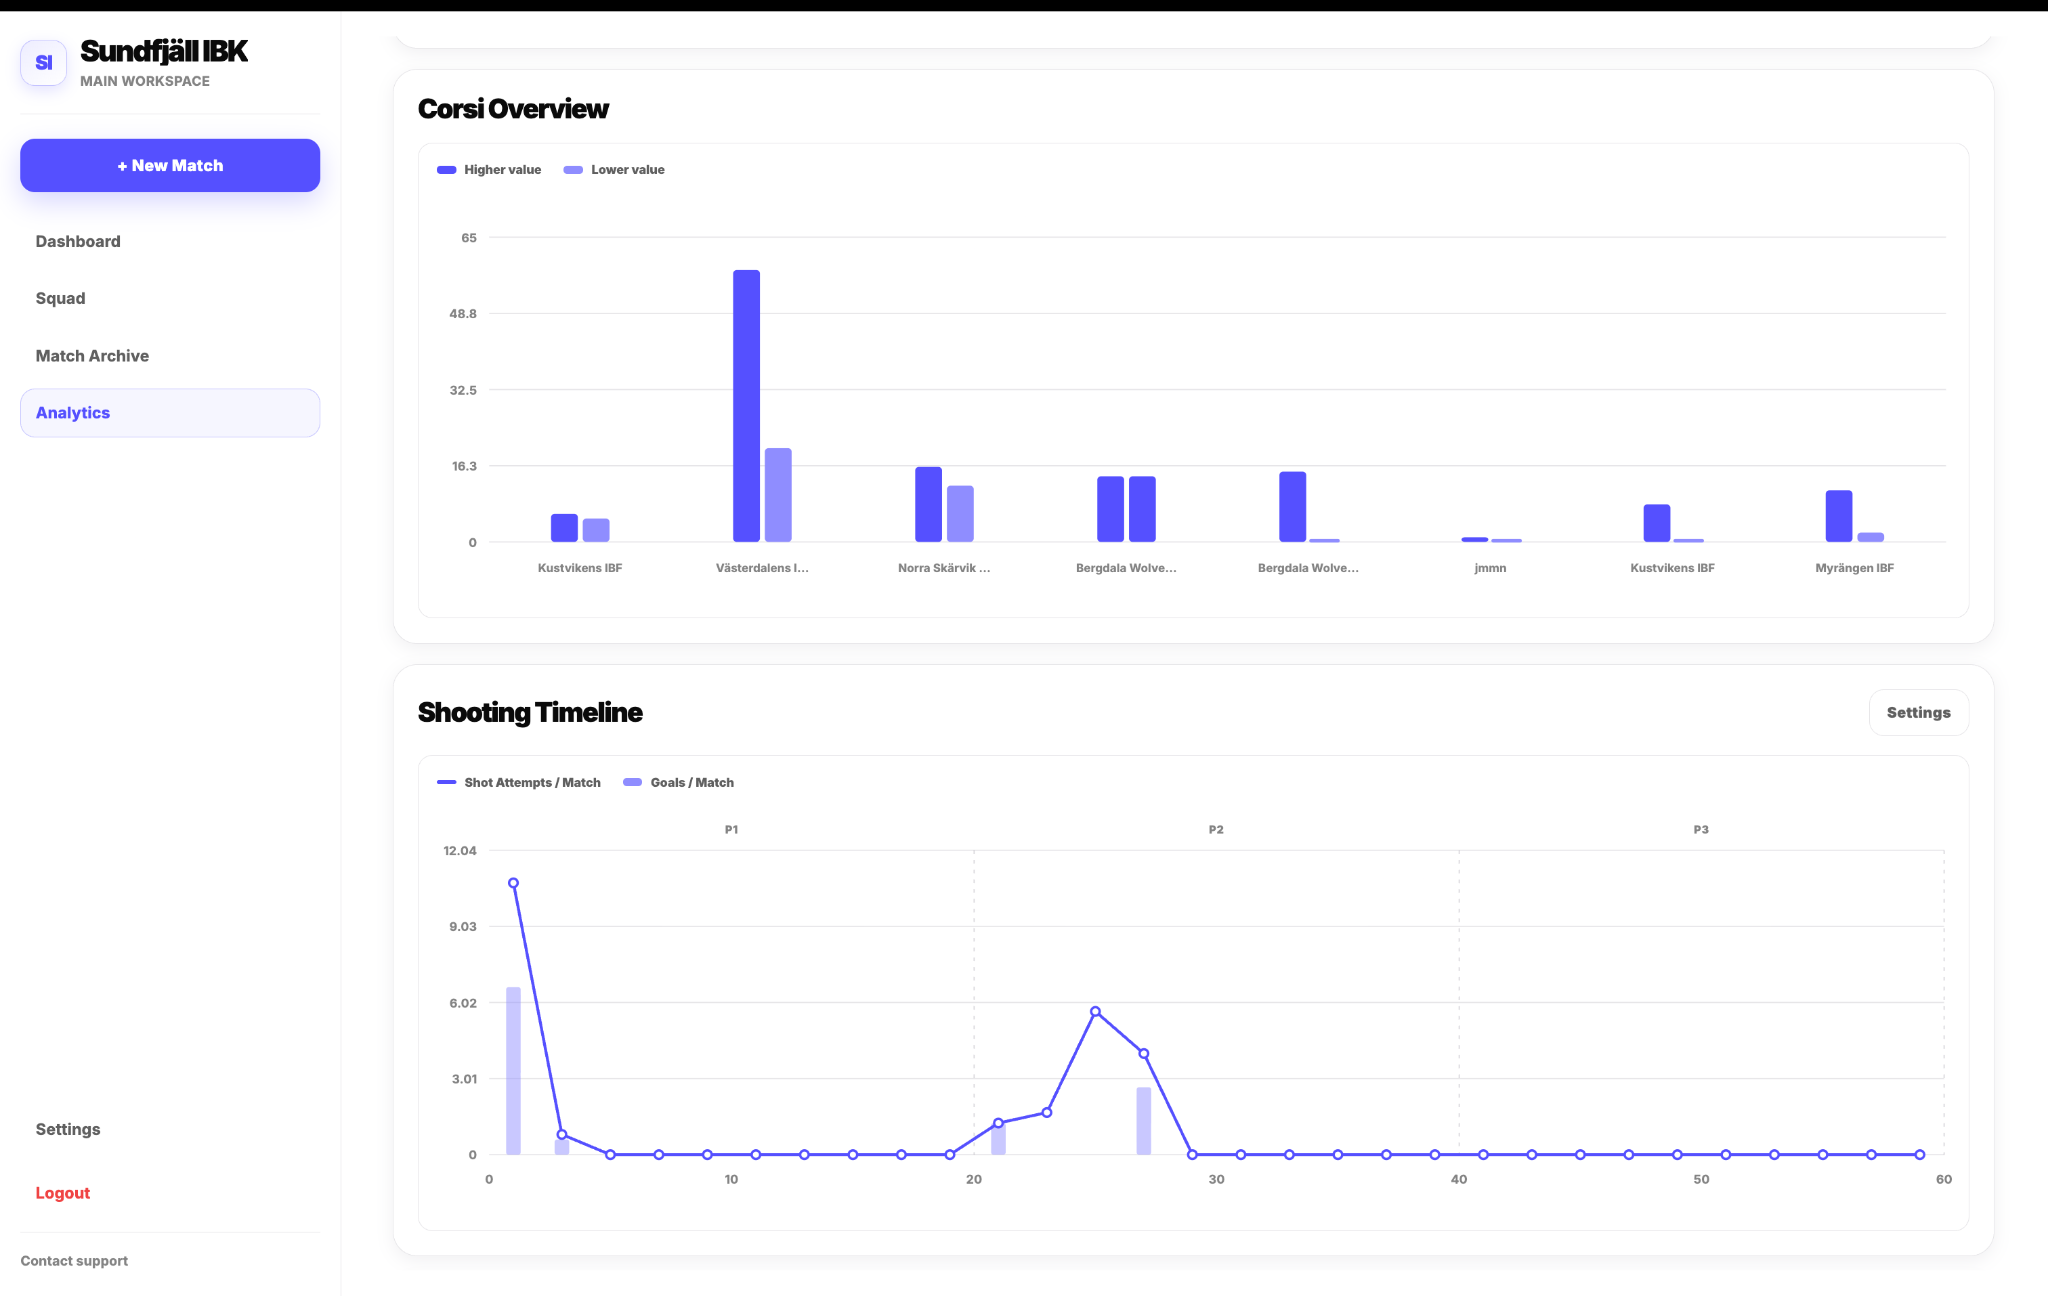
Corsi Overview compares shooting volume for Our Team and Opposition match by match. Shooting Timeline shows when during games the team creates shot attempts and scores goals.
Shooting Maps
Shooting Maps let you isolate specific players and shot outcomes. Four views are available: Shot Map, Shot & Assist Map, Shot Volume Heatmap and xG Performance Heatmap.
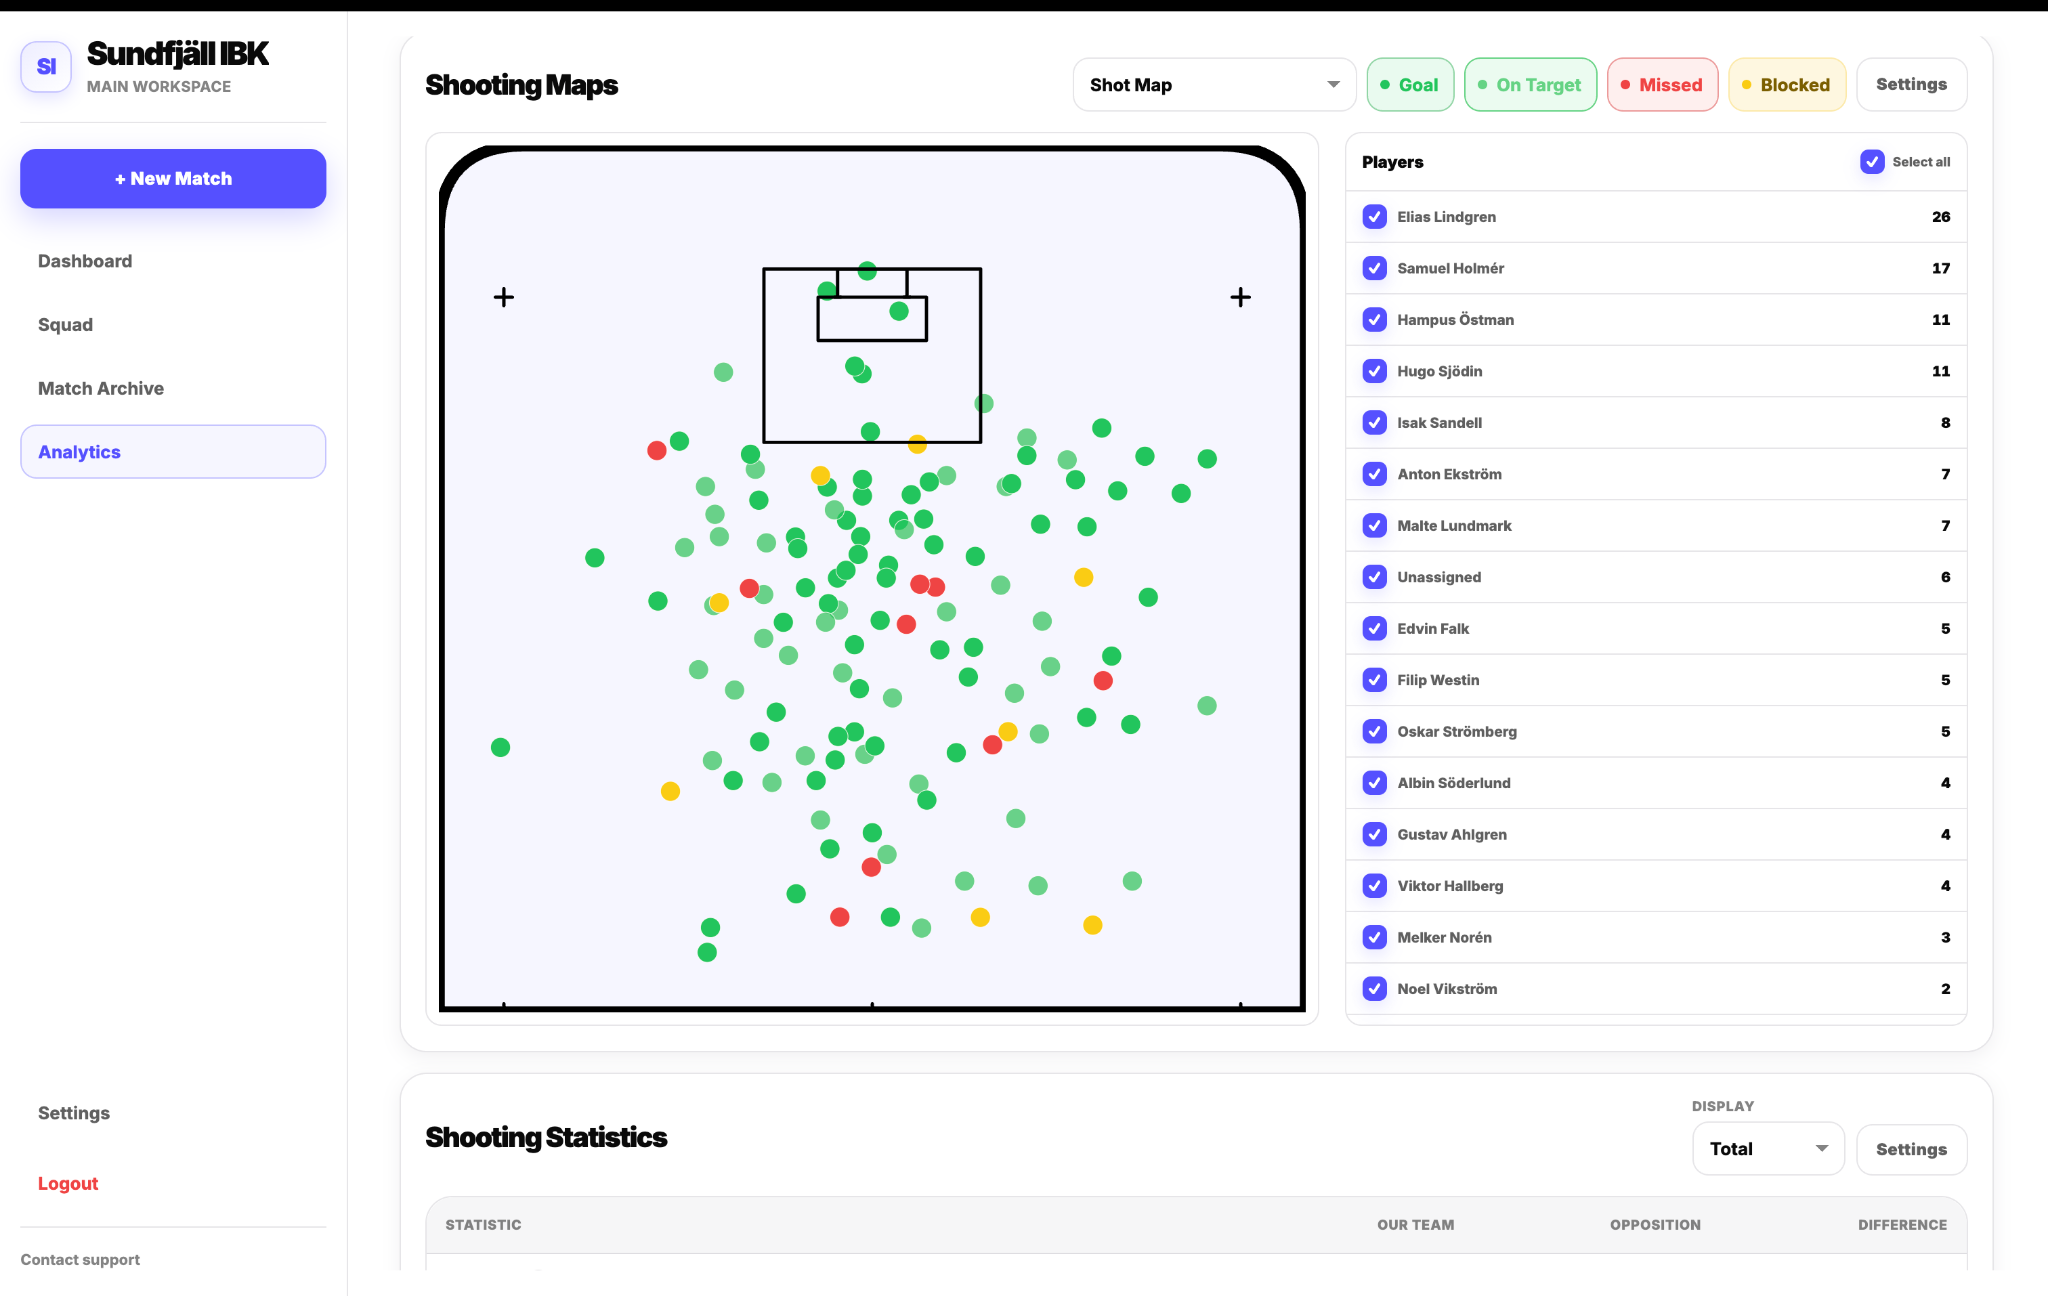
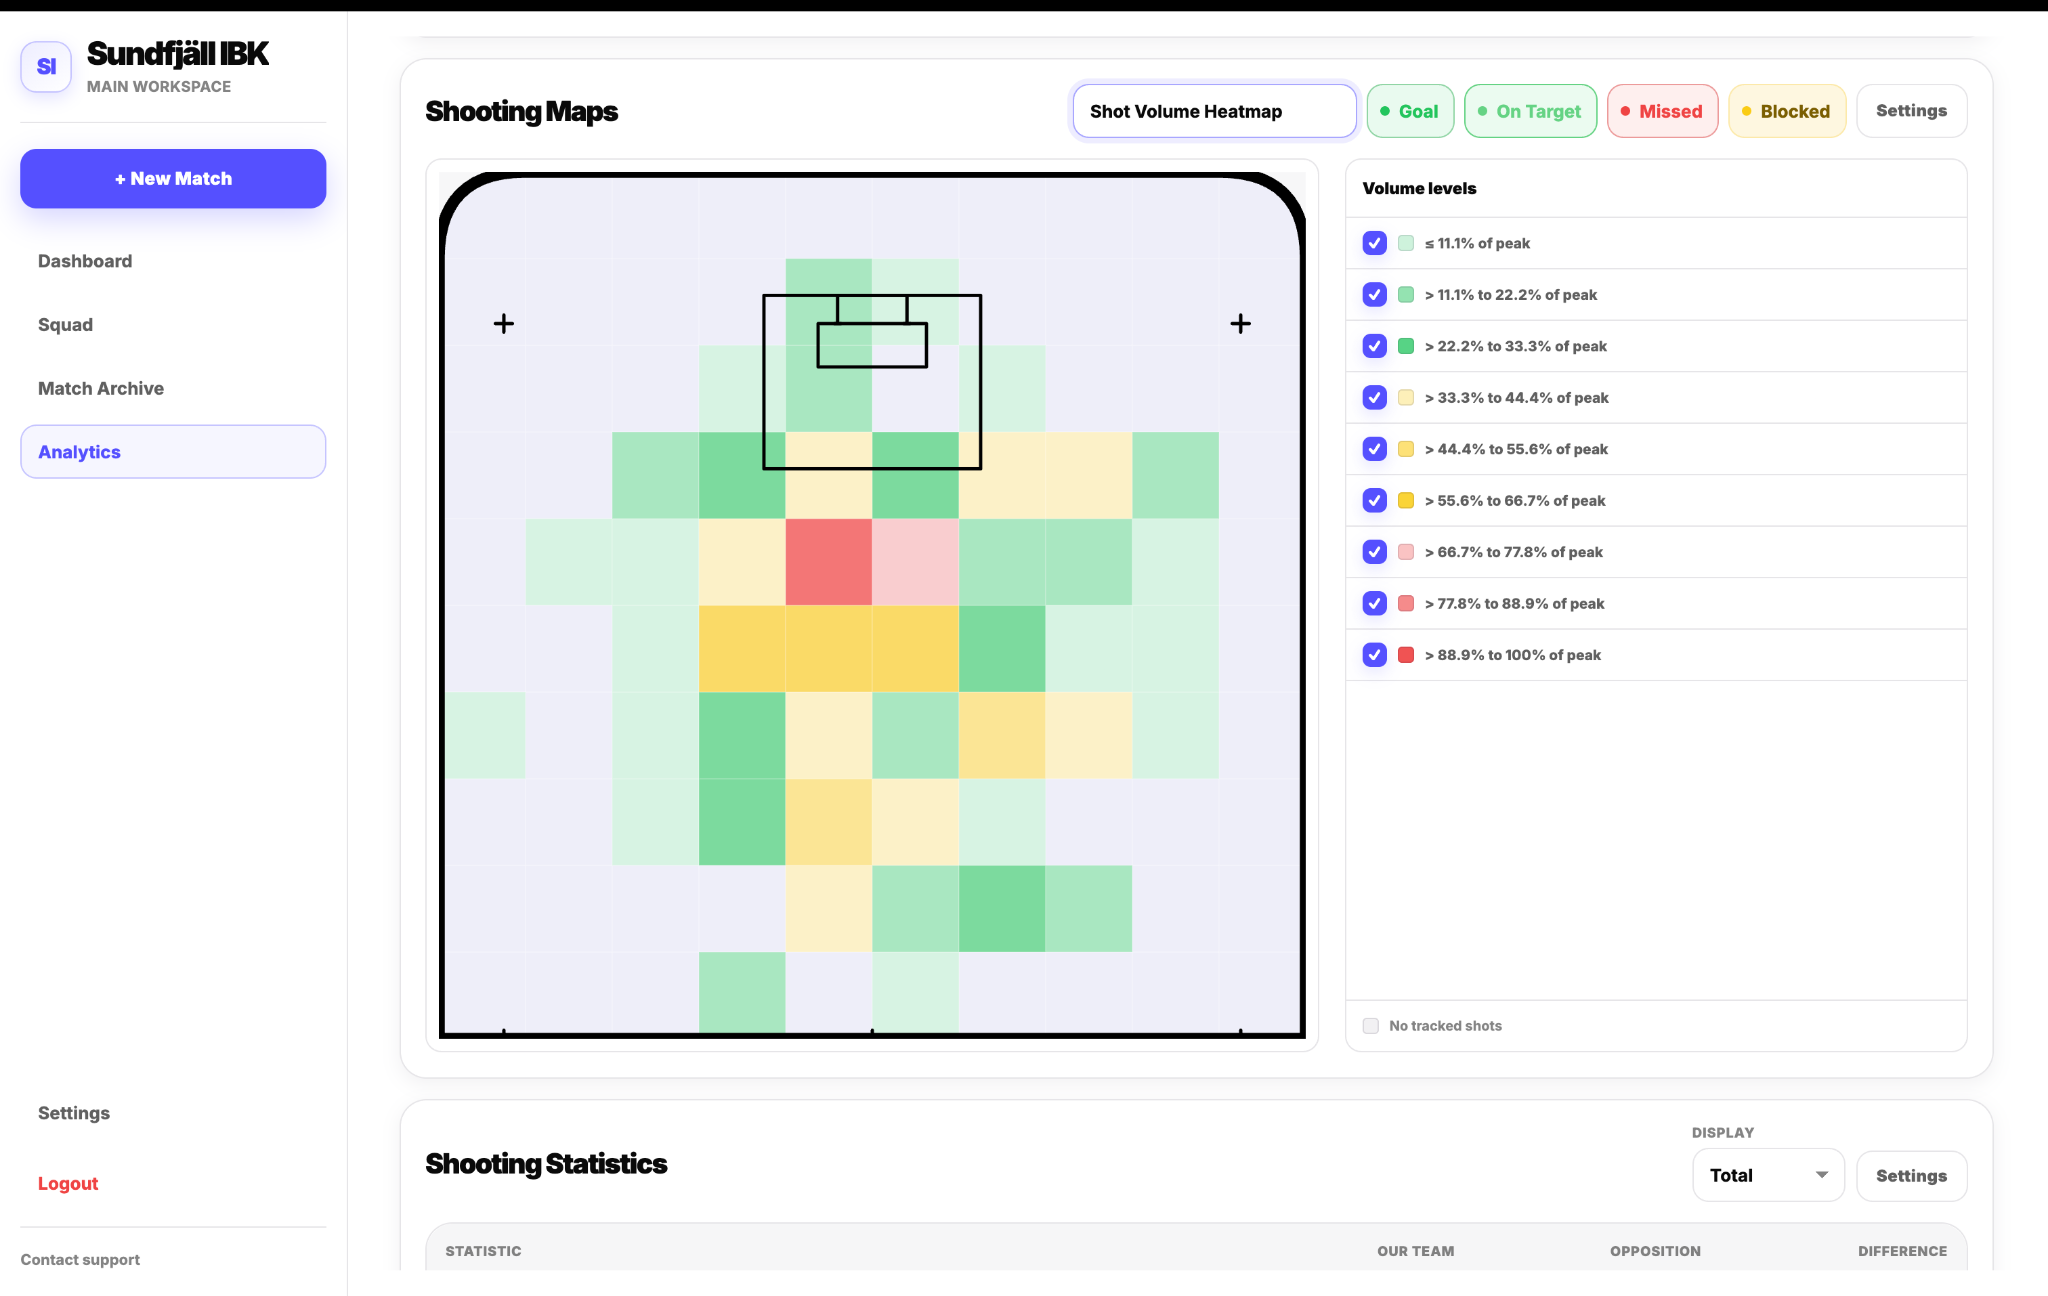
A Shooting Statistics table below the maps provides numerical detail and can be broken down for specific matches.
Statistics & Export
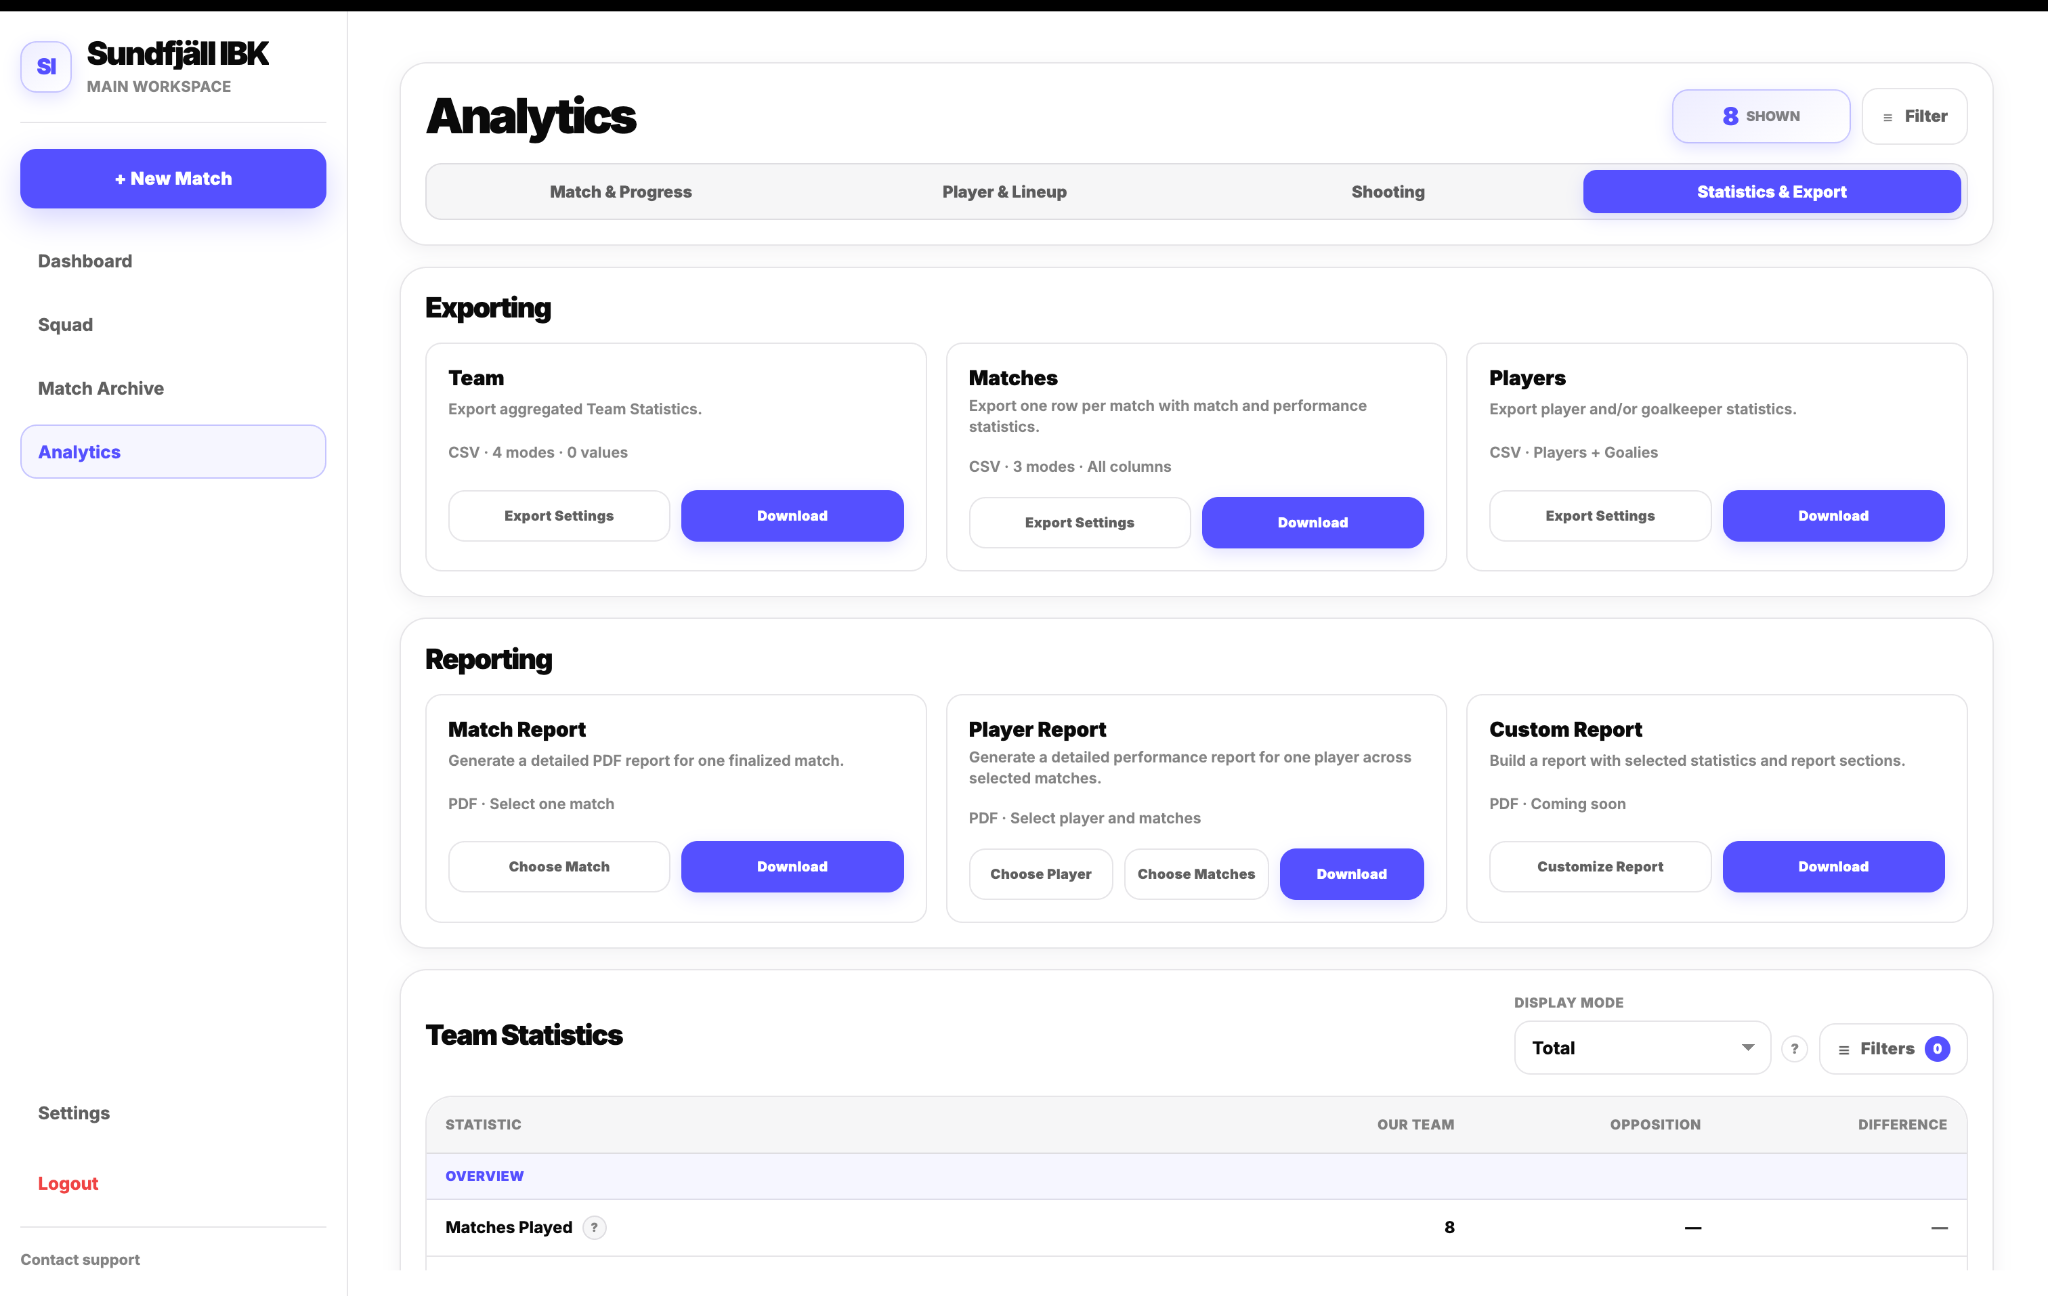
The former Stats panel is now Statistics & Export. It keeps the Event Field Overview and replaces the old statistic cards with a structured Team Statistics table for long-term aggregated team data.
Exporting
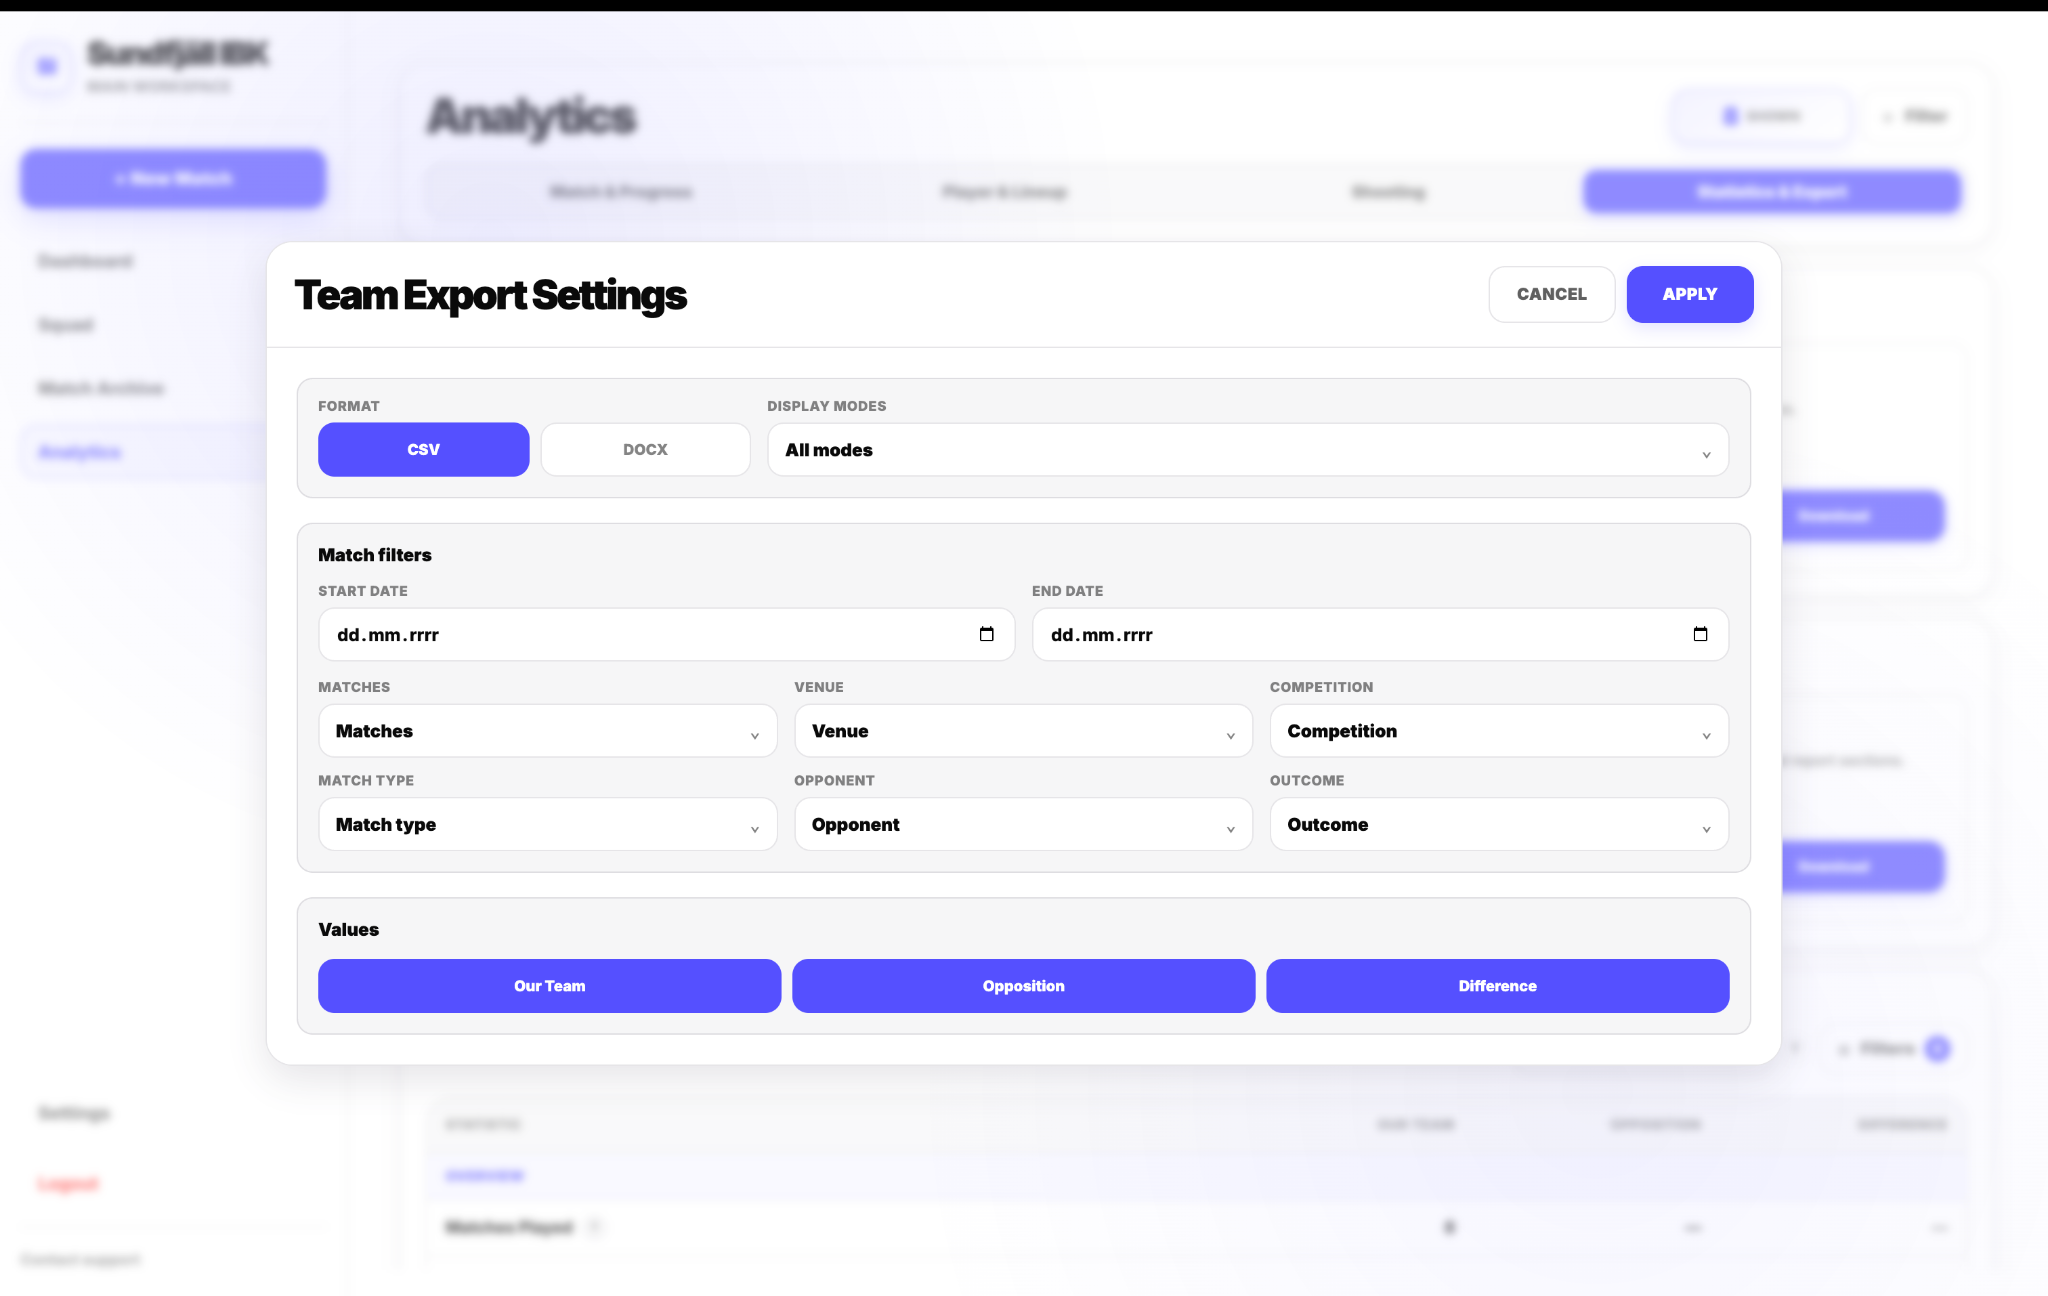
Exporting lets you download data in three primary structures: Team, Matches and Players. Export Settings provide control over the sample and values included, including match filters and display modes.
Reporting
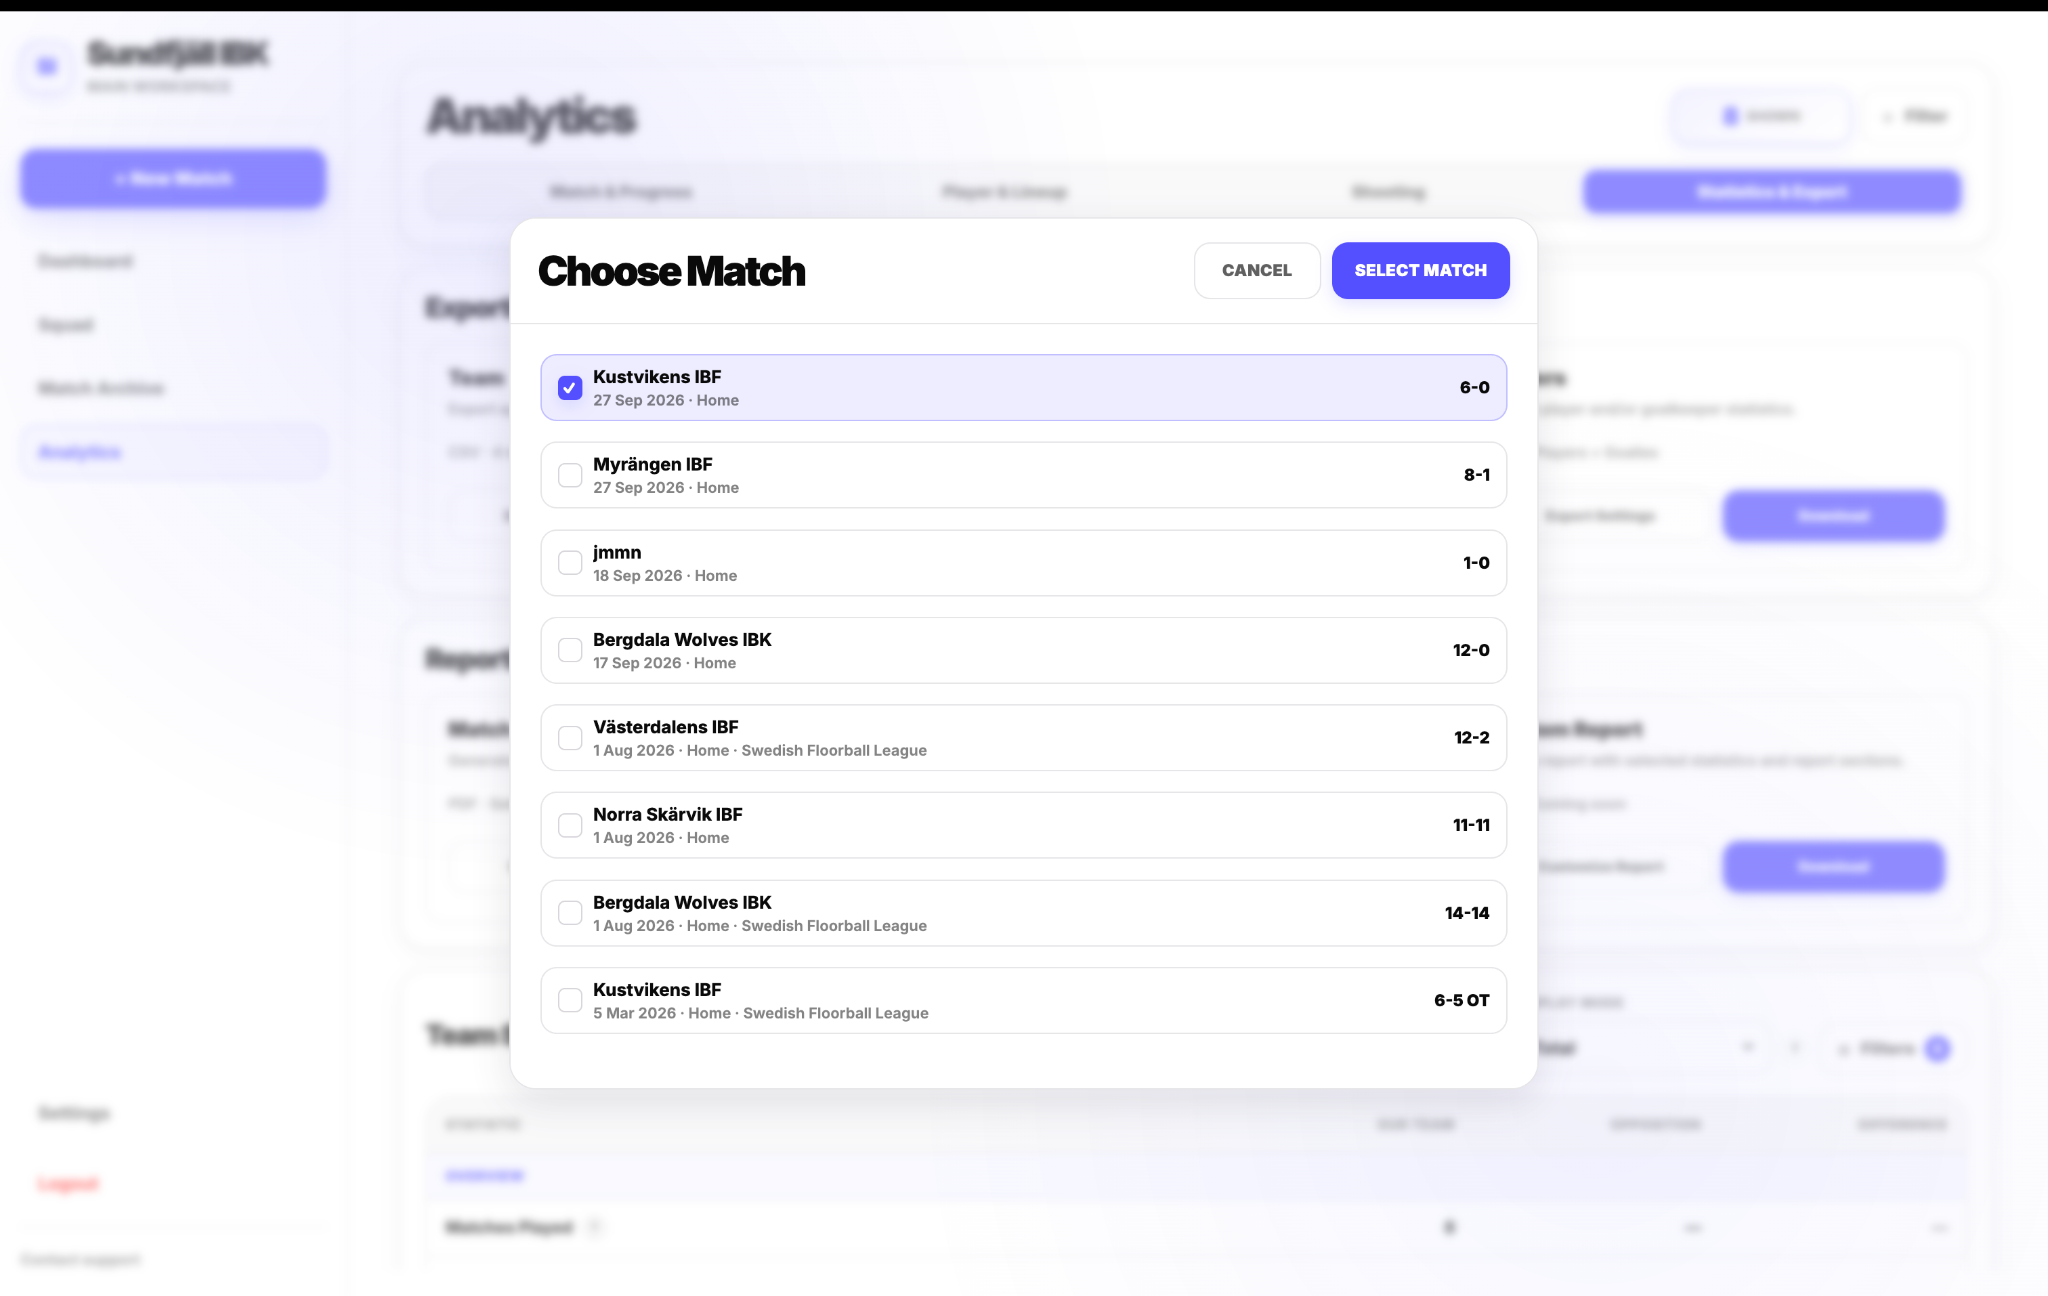
Reporting turns Analytics into a distribution workflow, not only a place to inspect data. You can currently generate a Match Report for a selected finalized match or a Player Report for a selected player and match sample.
The reports are detailed PDFs prepared for direct use with coaching staff and players, so analytical output can move into the review process without rebuilding the same information manually.
In Settings, automatic delivery of a Match Report can be enabled for a selected email after a match is ended. This can put a detailed post-match review into the staff workflow within about five minutes, shortening the feedback loop between tracking, analysis and review.