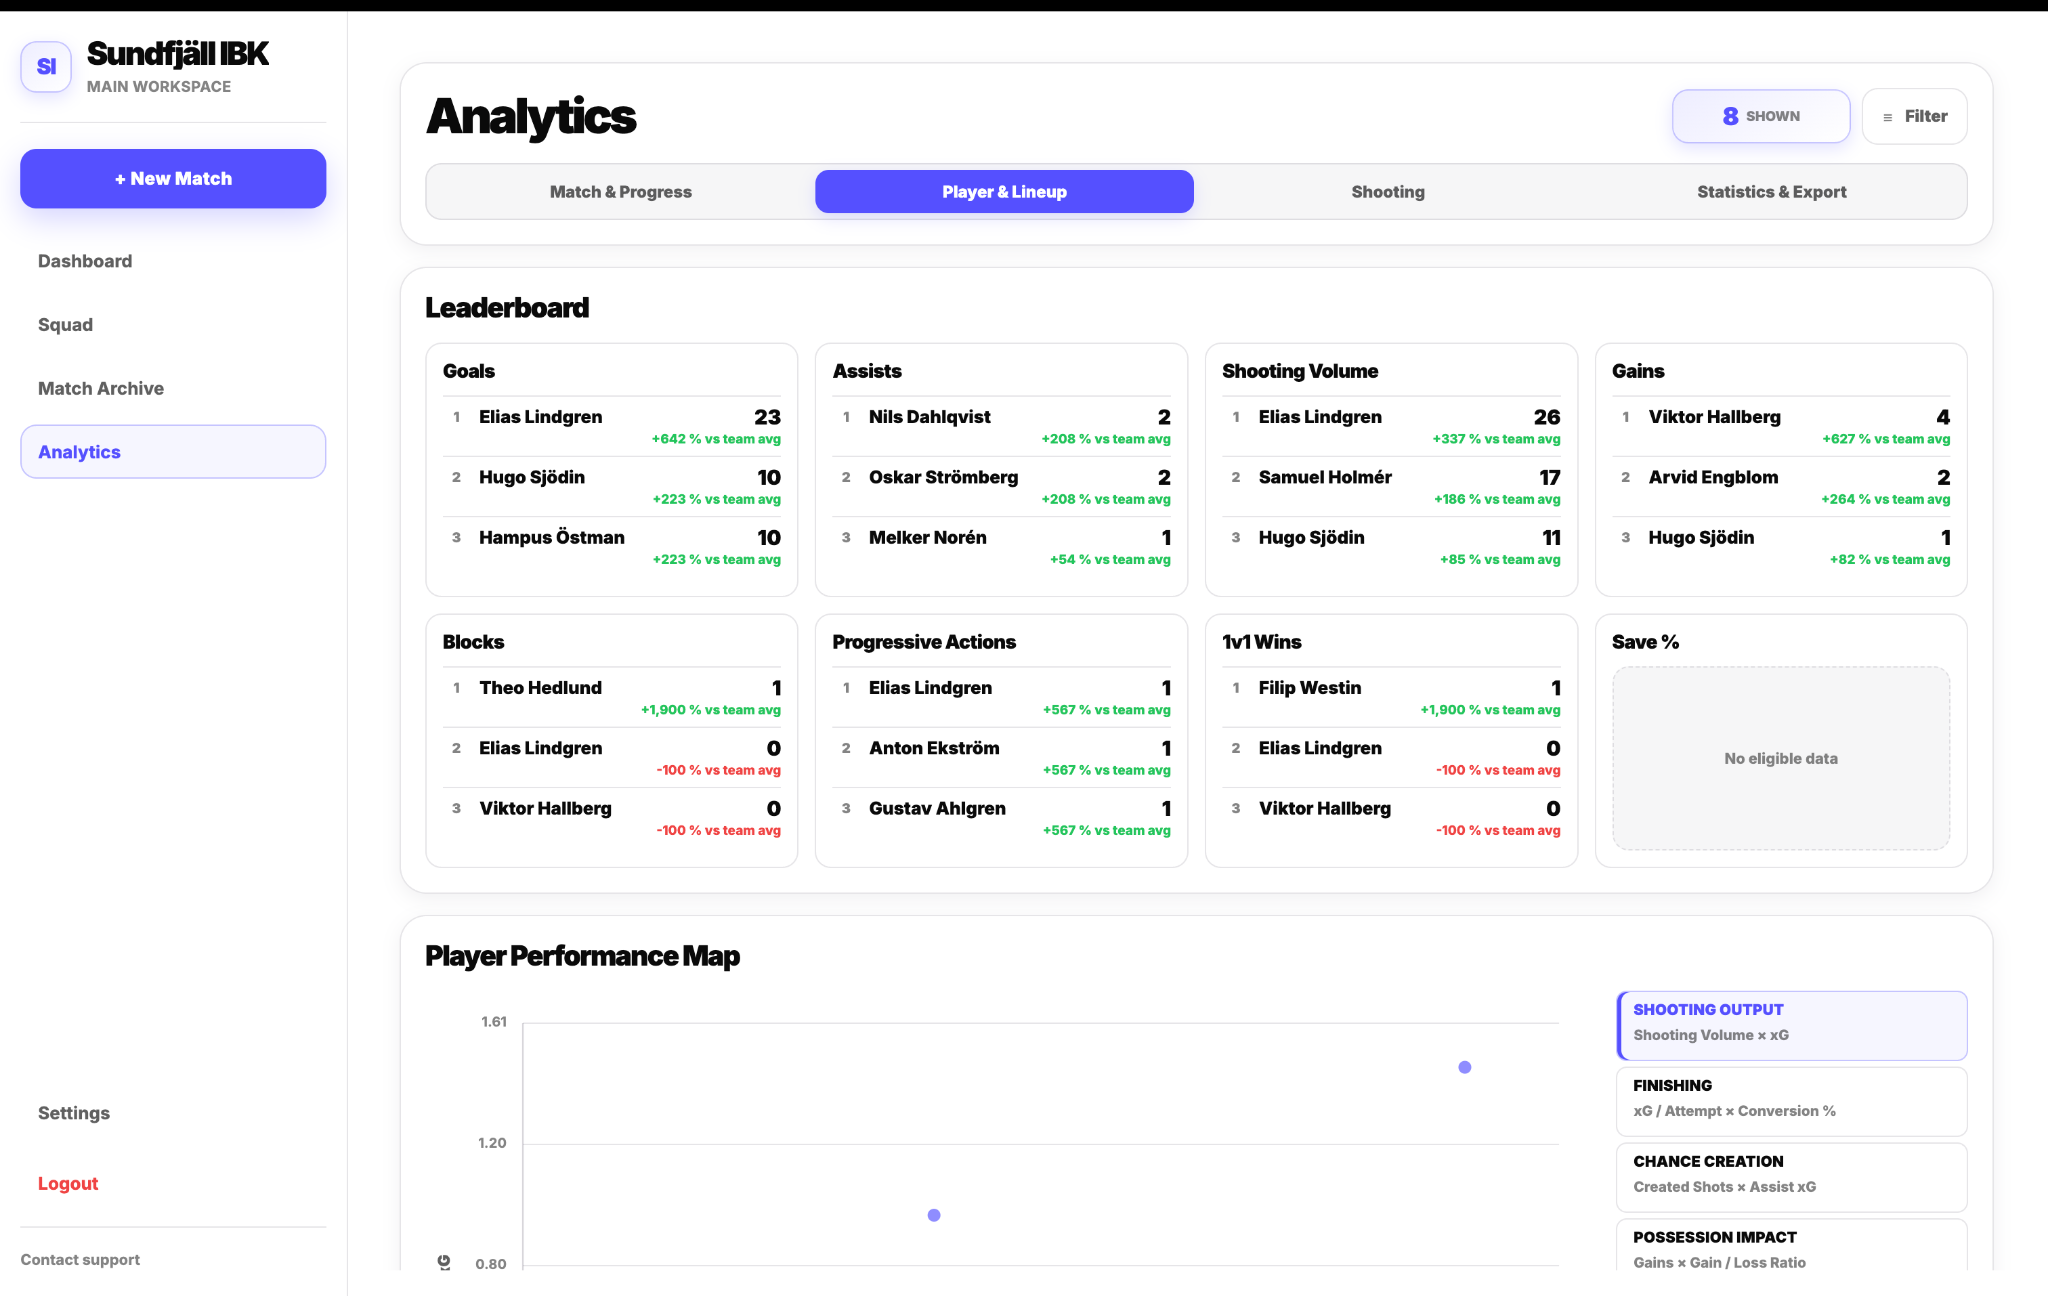
Analytics is now built around four clear workflows
Analytics 2.0 reorganizes the page into Match & Progress, Player & Lineup, Shooting, and Statistics & Export. Each panel is designed around a different analytical question, while the main filter keeps the selected match sample connected across the workspace.
From statistic cards to structured tables
The previous card-based display has been replaced by comprehensive tables wherever detailed numerical analysis matters. Match Statistics covers team performance for the selected matches, Player Statistics provides dedicated field-player and goalkeeper views, and Team Statistics provides the long-term aggregated team picture.
The tables are grouped into clear sections and can be filtered to specific matches, periods and contexts, making it easier to move between a quick overview and a deeper sample.
A new player-analysis layer
The Player & Lineup panel now starts with a Leaderboard showing the top three players across important metrics. The new Player Performance Map then lets you view the squad through seven presets: Shooting Output, Finishing, Chance Creation, Possession Impact, Progression, 1v1 Impact and Shot Blocking.
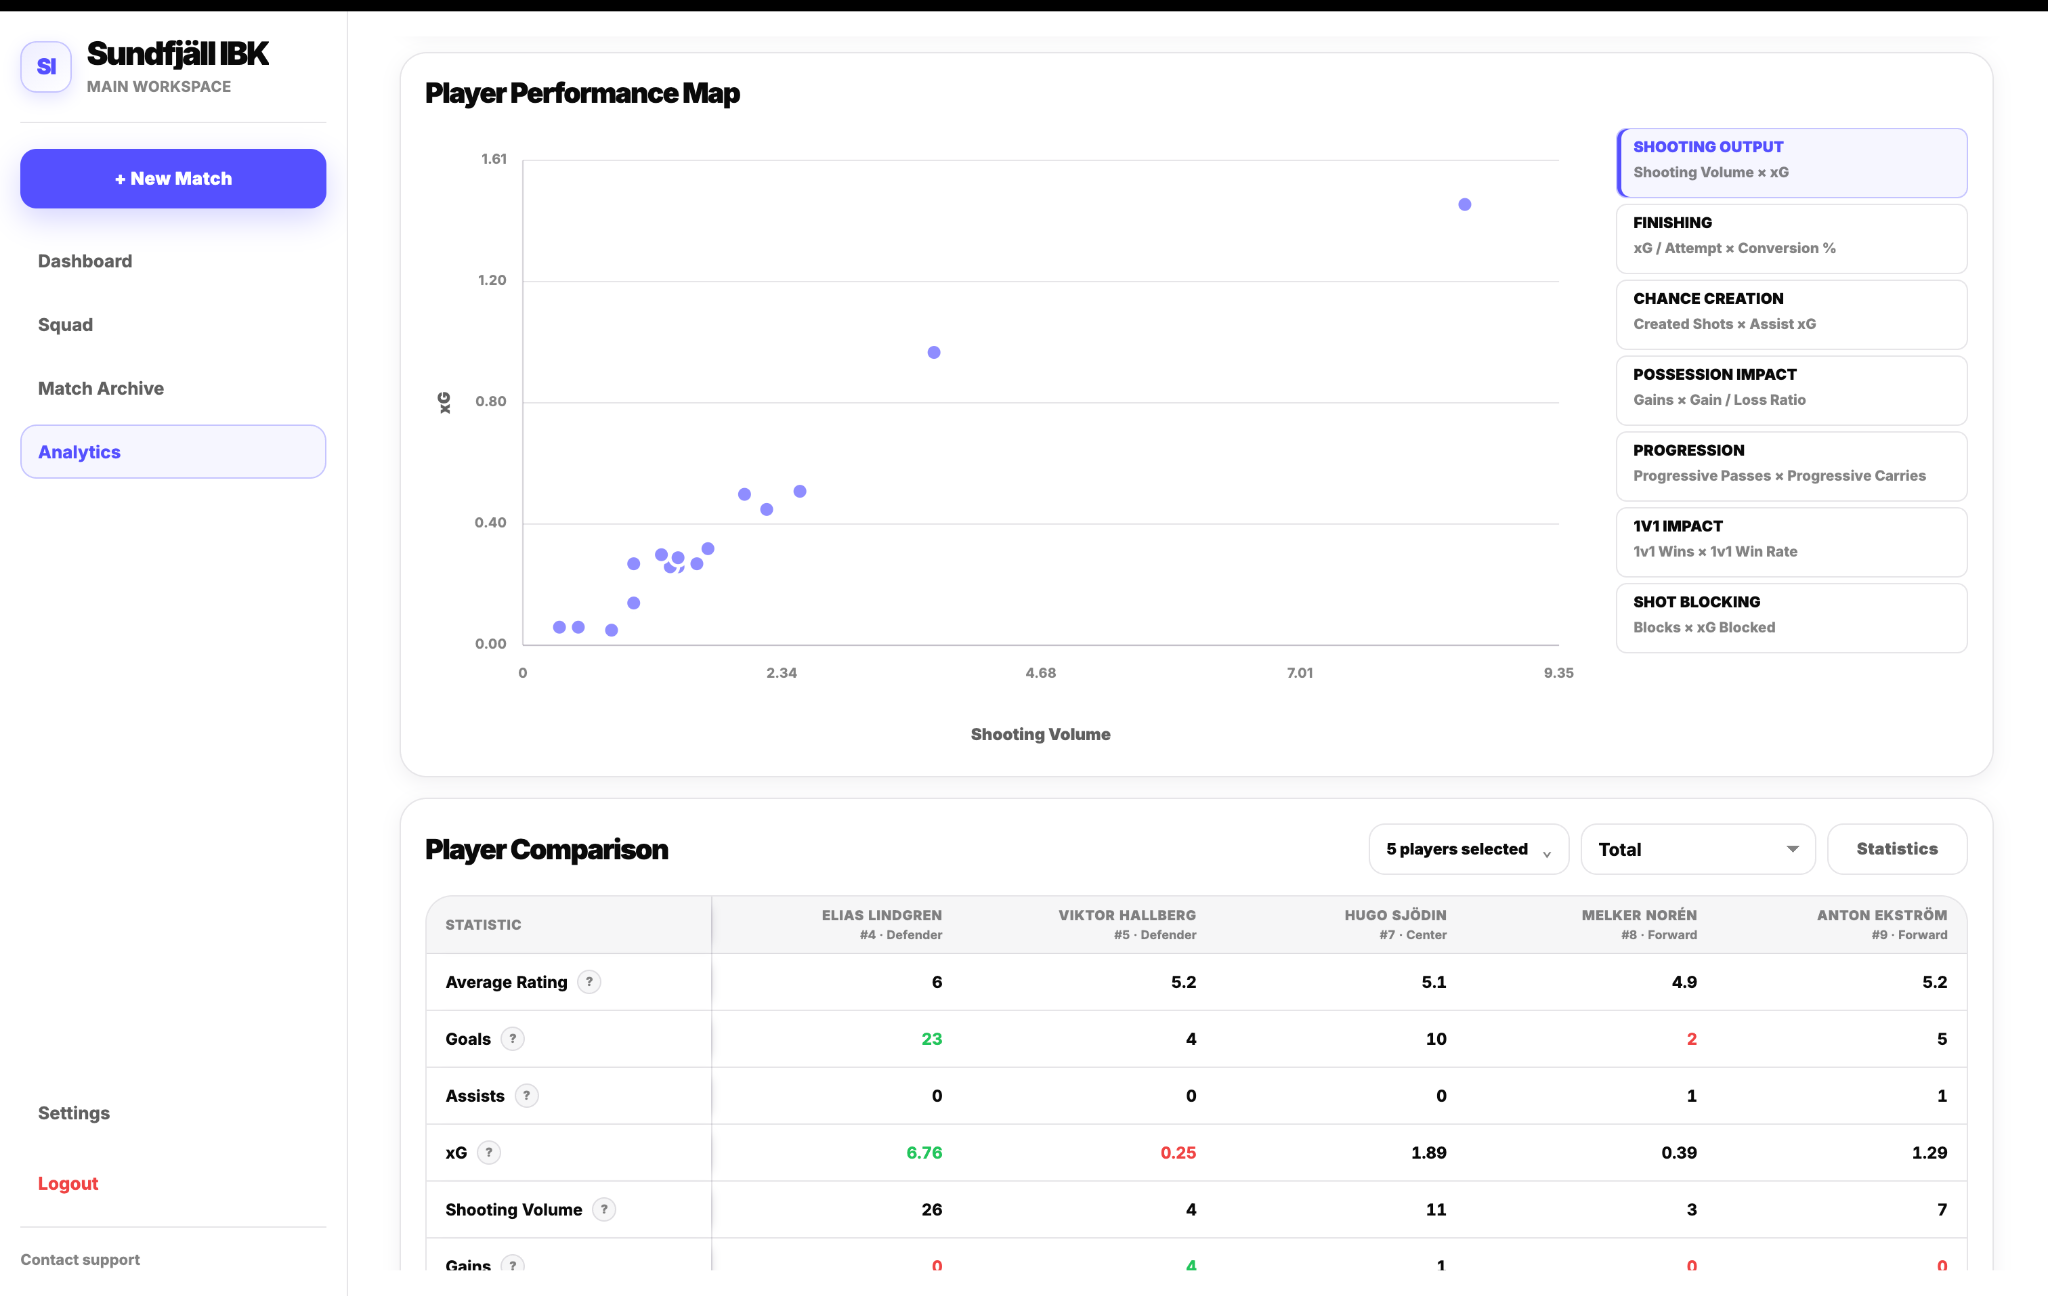
Player Comparison adds a direct workflow: select up to five players and choose the statistics you want to compare. For full detail, the Player Statistics table is available for both field players and goalkeepers.
A dedicated Shooting workspace
Shooting is now its own Analytics panel. Shooting Overview puts the core metrics and opposition comparison first. Shooting Profile separates players by shot volume and chance quality, while the xG Performance Map shows who is overperforming or underperforming expected goals.
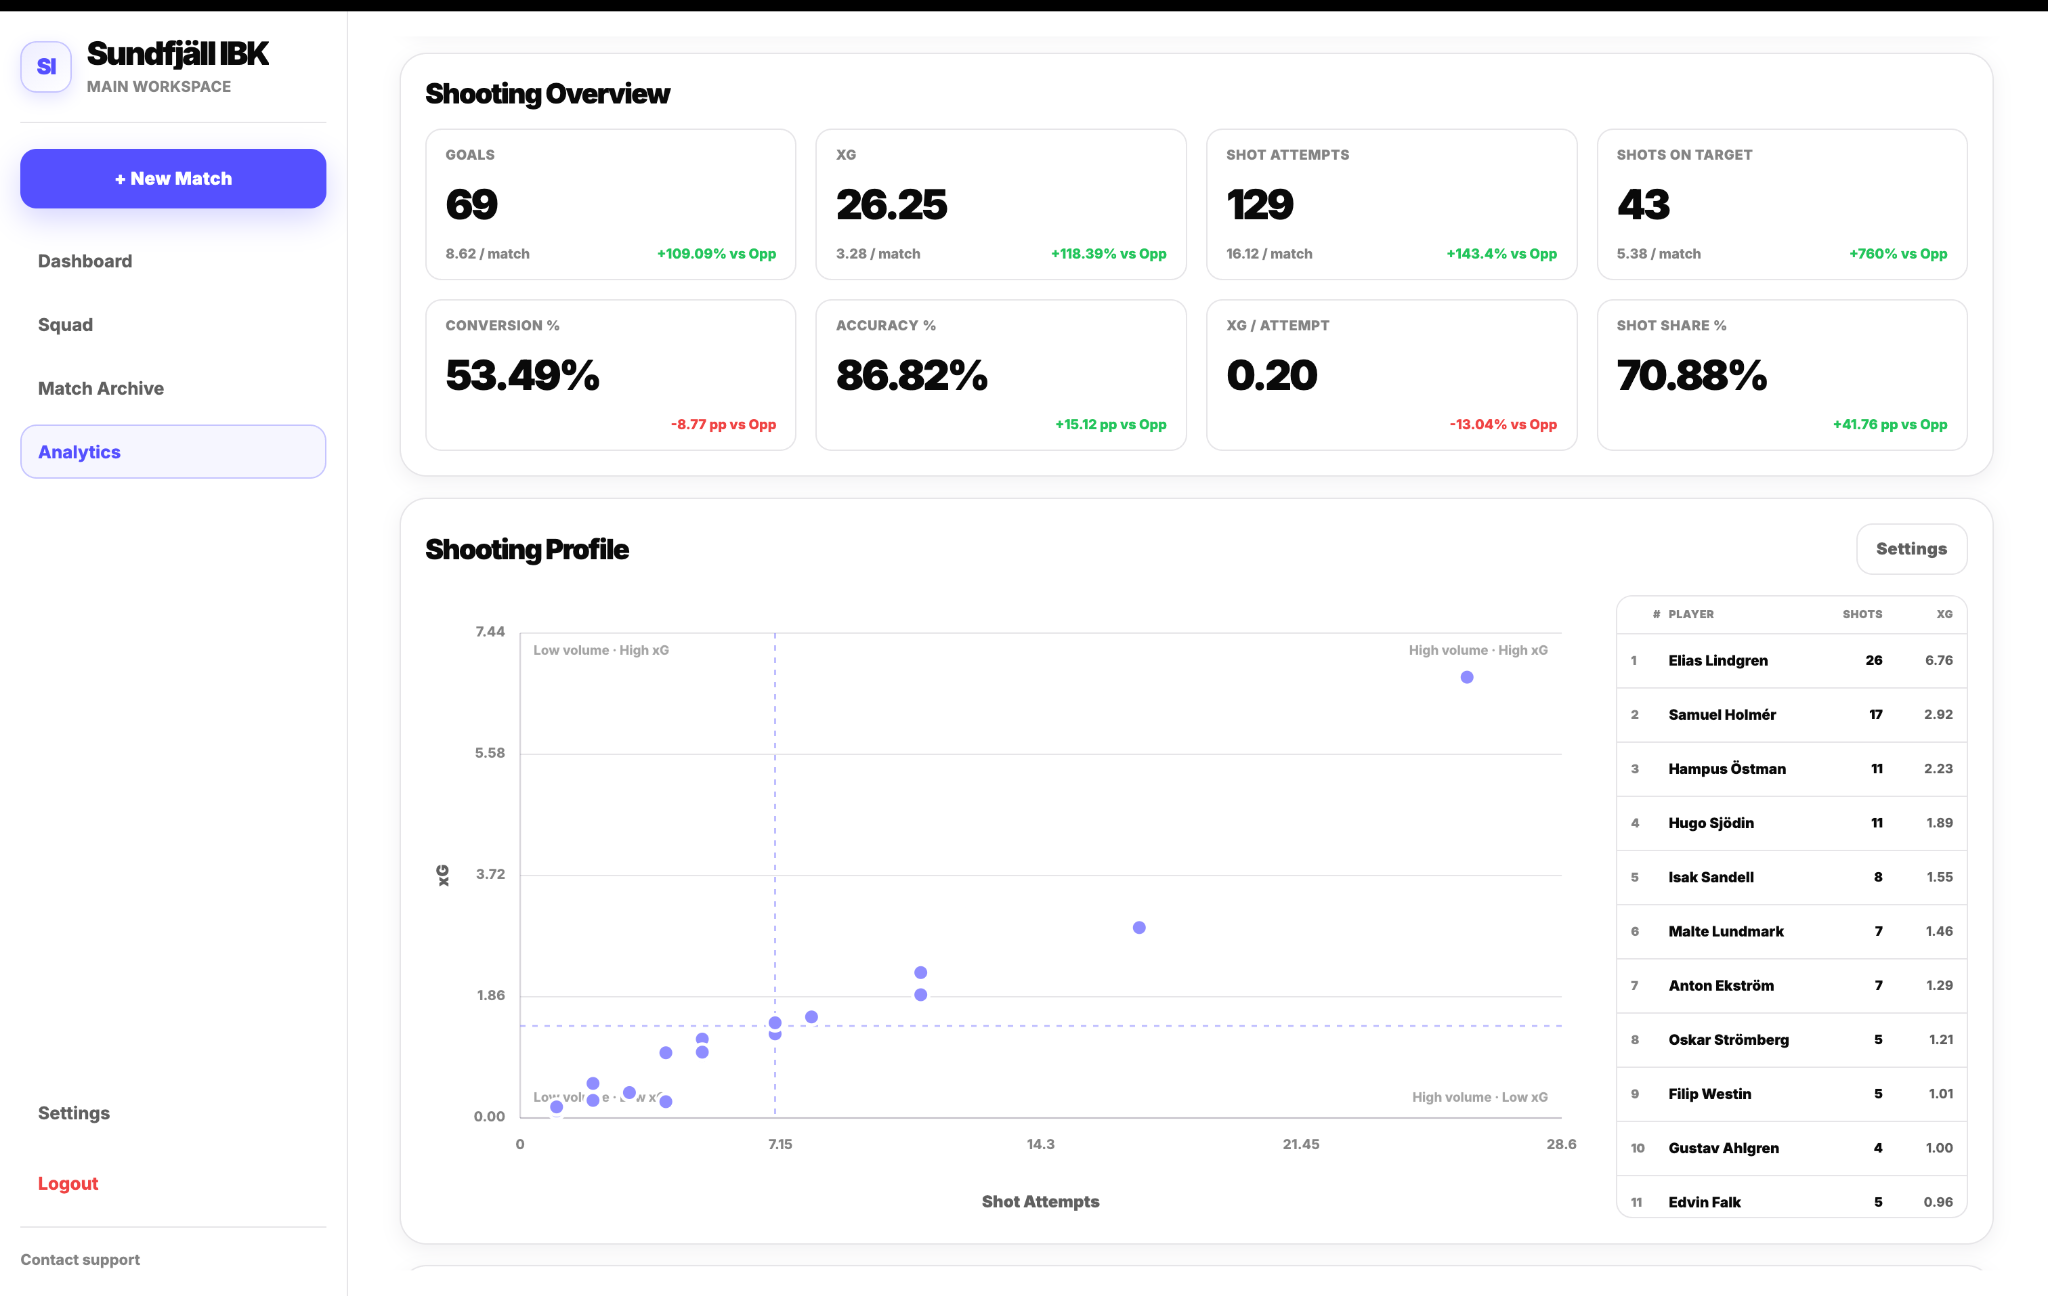
Corsi Overview follows shooting volume match by match, and Shooting Timeline shows when attempts and goals are being created during the game.
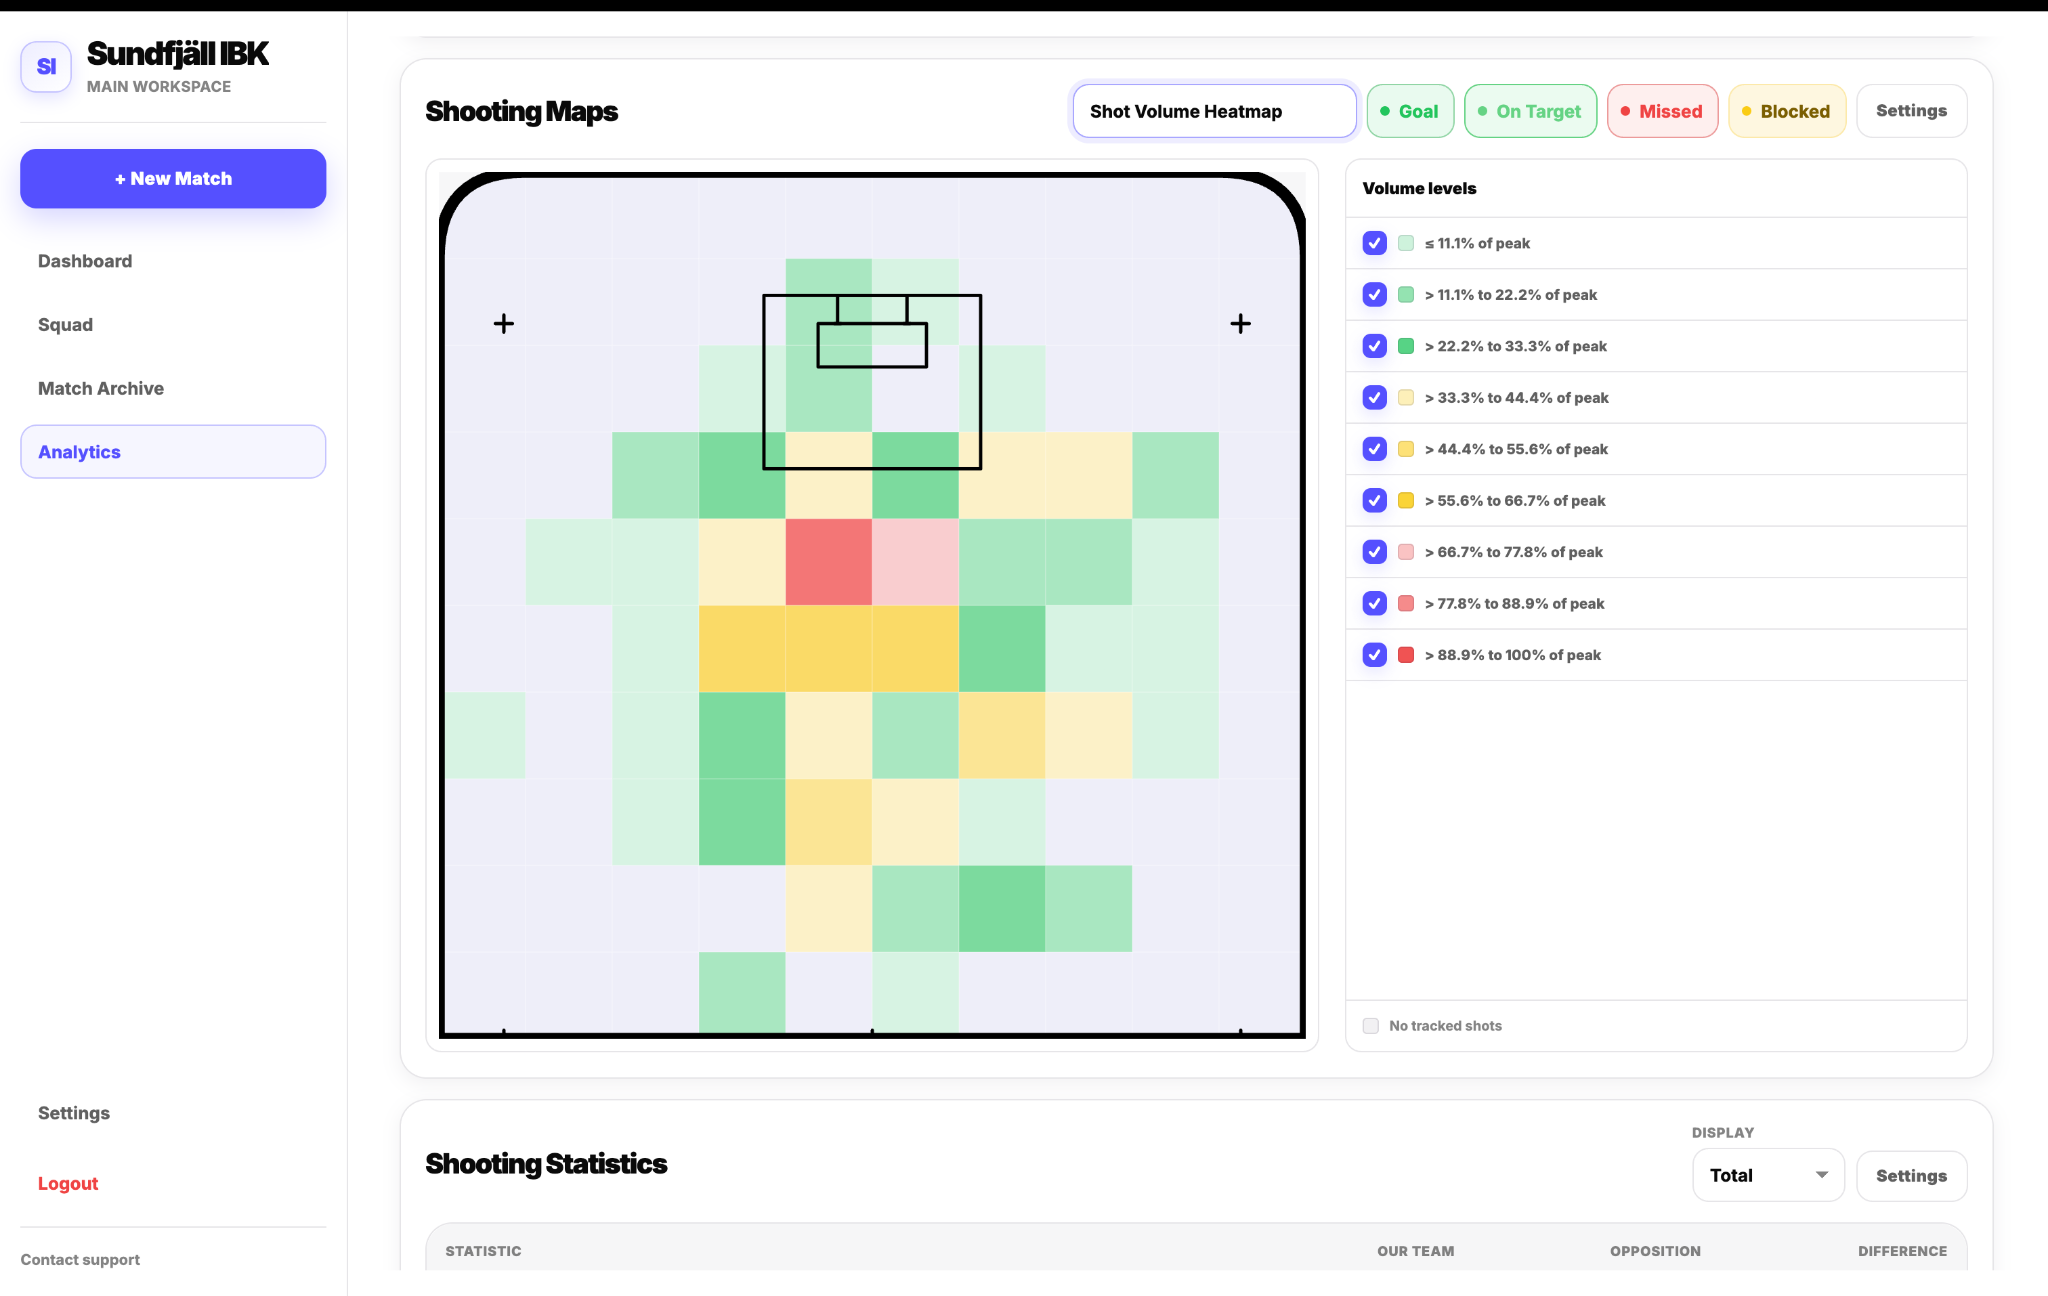
The spatial workflow is deeper as well. Shooting Maps support Shot Map, Shot & Assist Map, Shot Volume Heatmap and xG Performance Heatmap, with filters for specific players and shot outcomes.
Your data can leave the platform in the structure you need
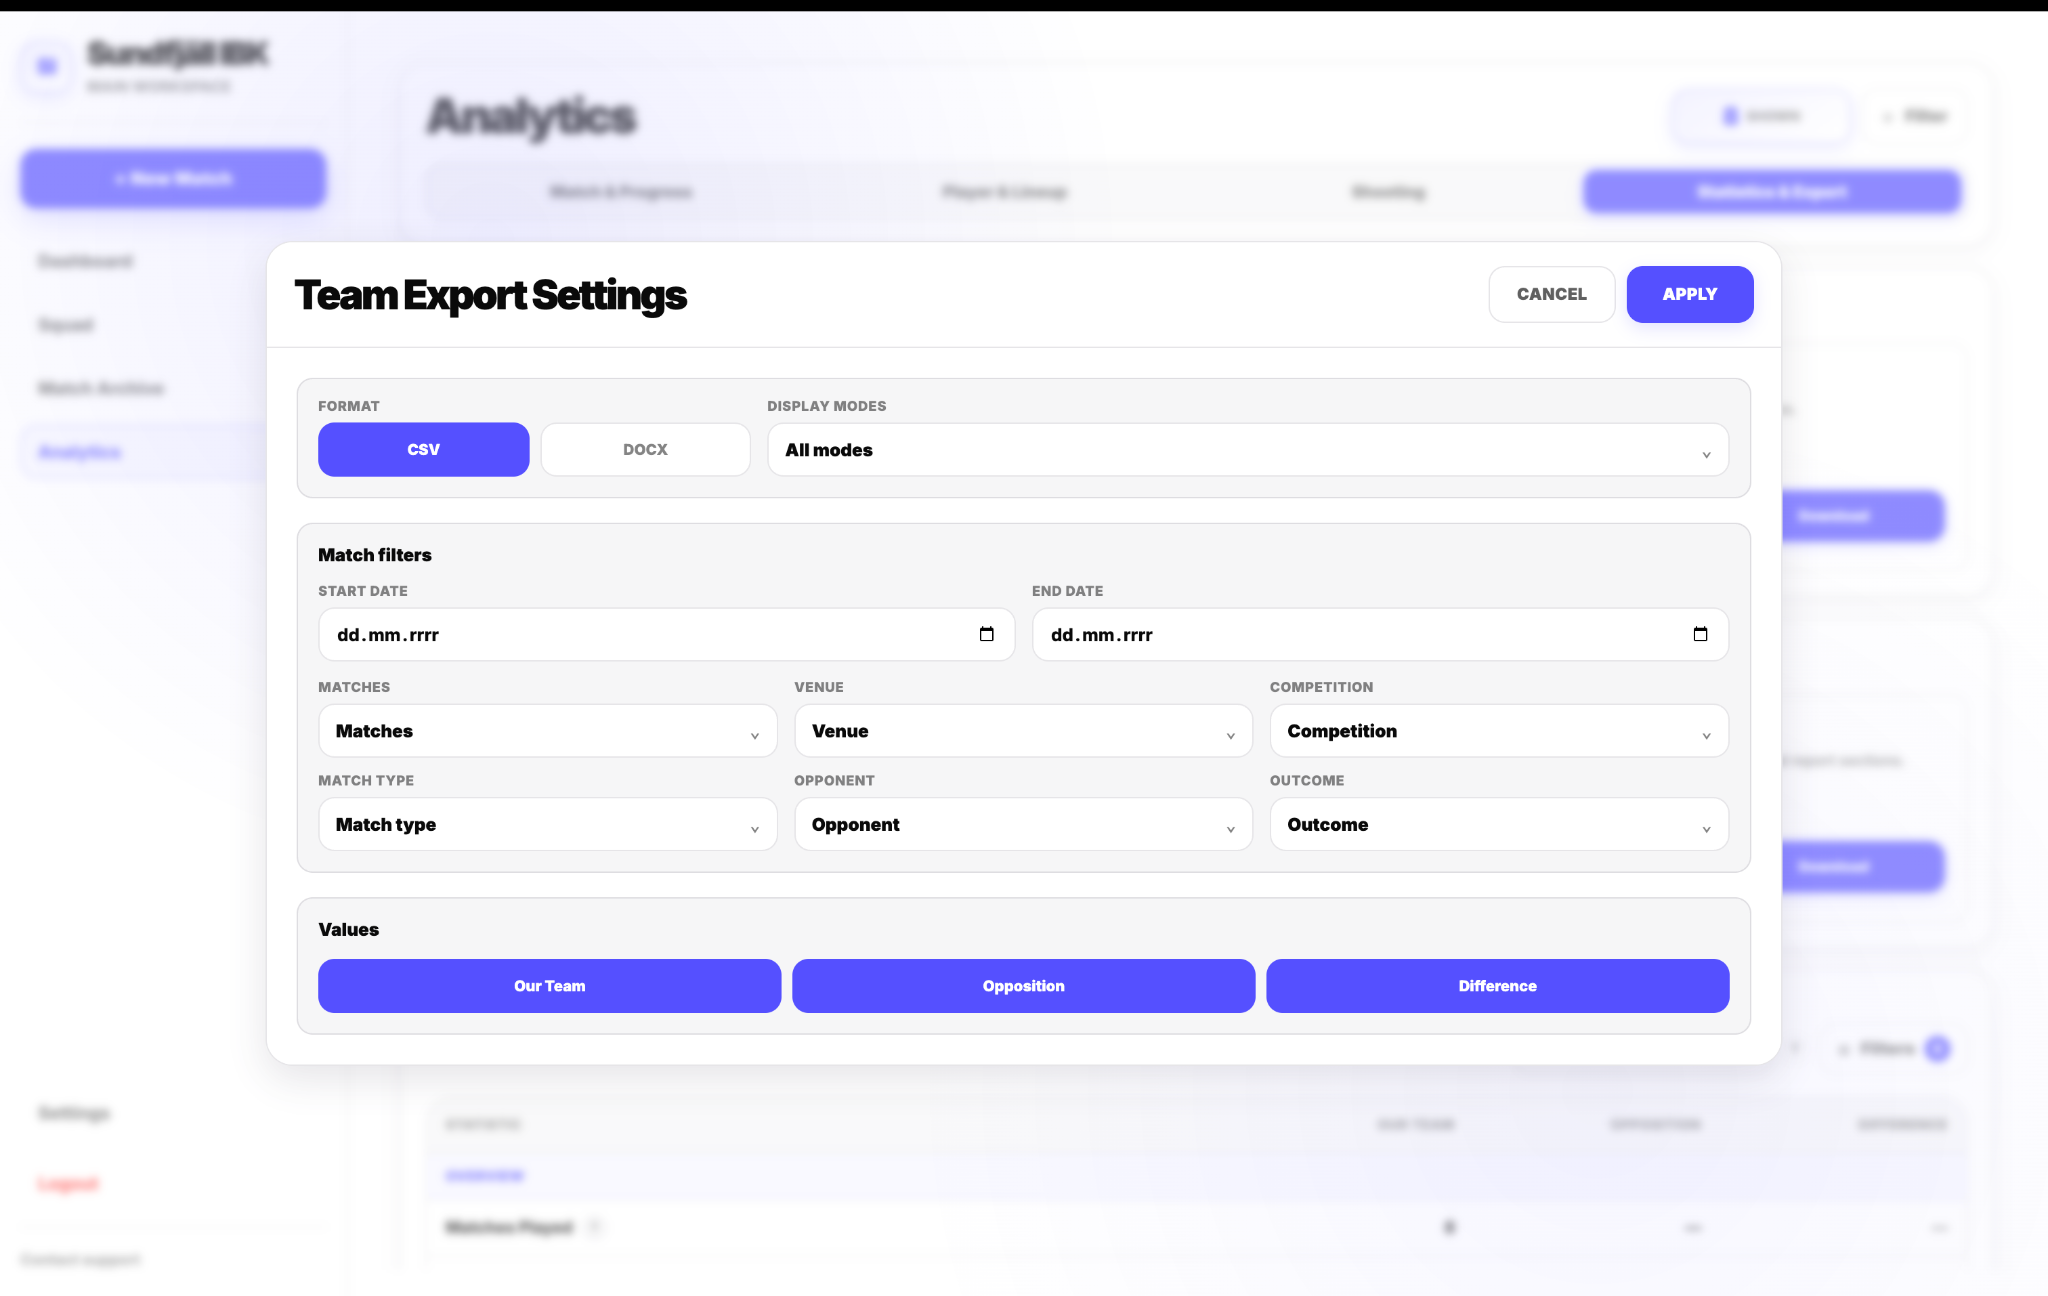
Statistics & Export adds a dedicated Exporting section. Team, Matches and Players are the three primary export structures, with settings for choosing the sample, display mode and values included.
Reporting closes the feedback loop
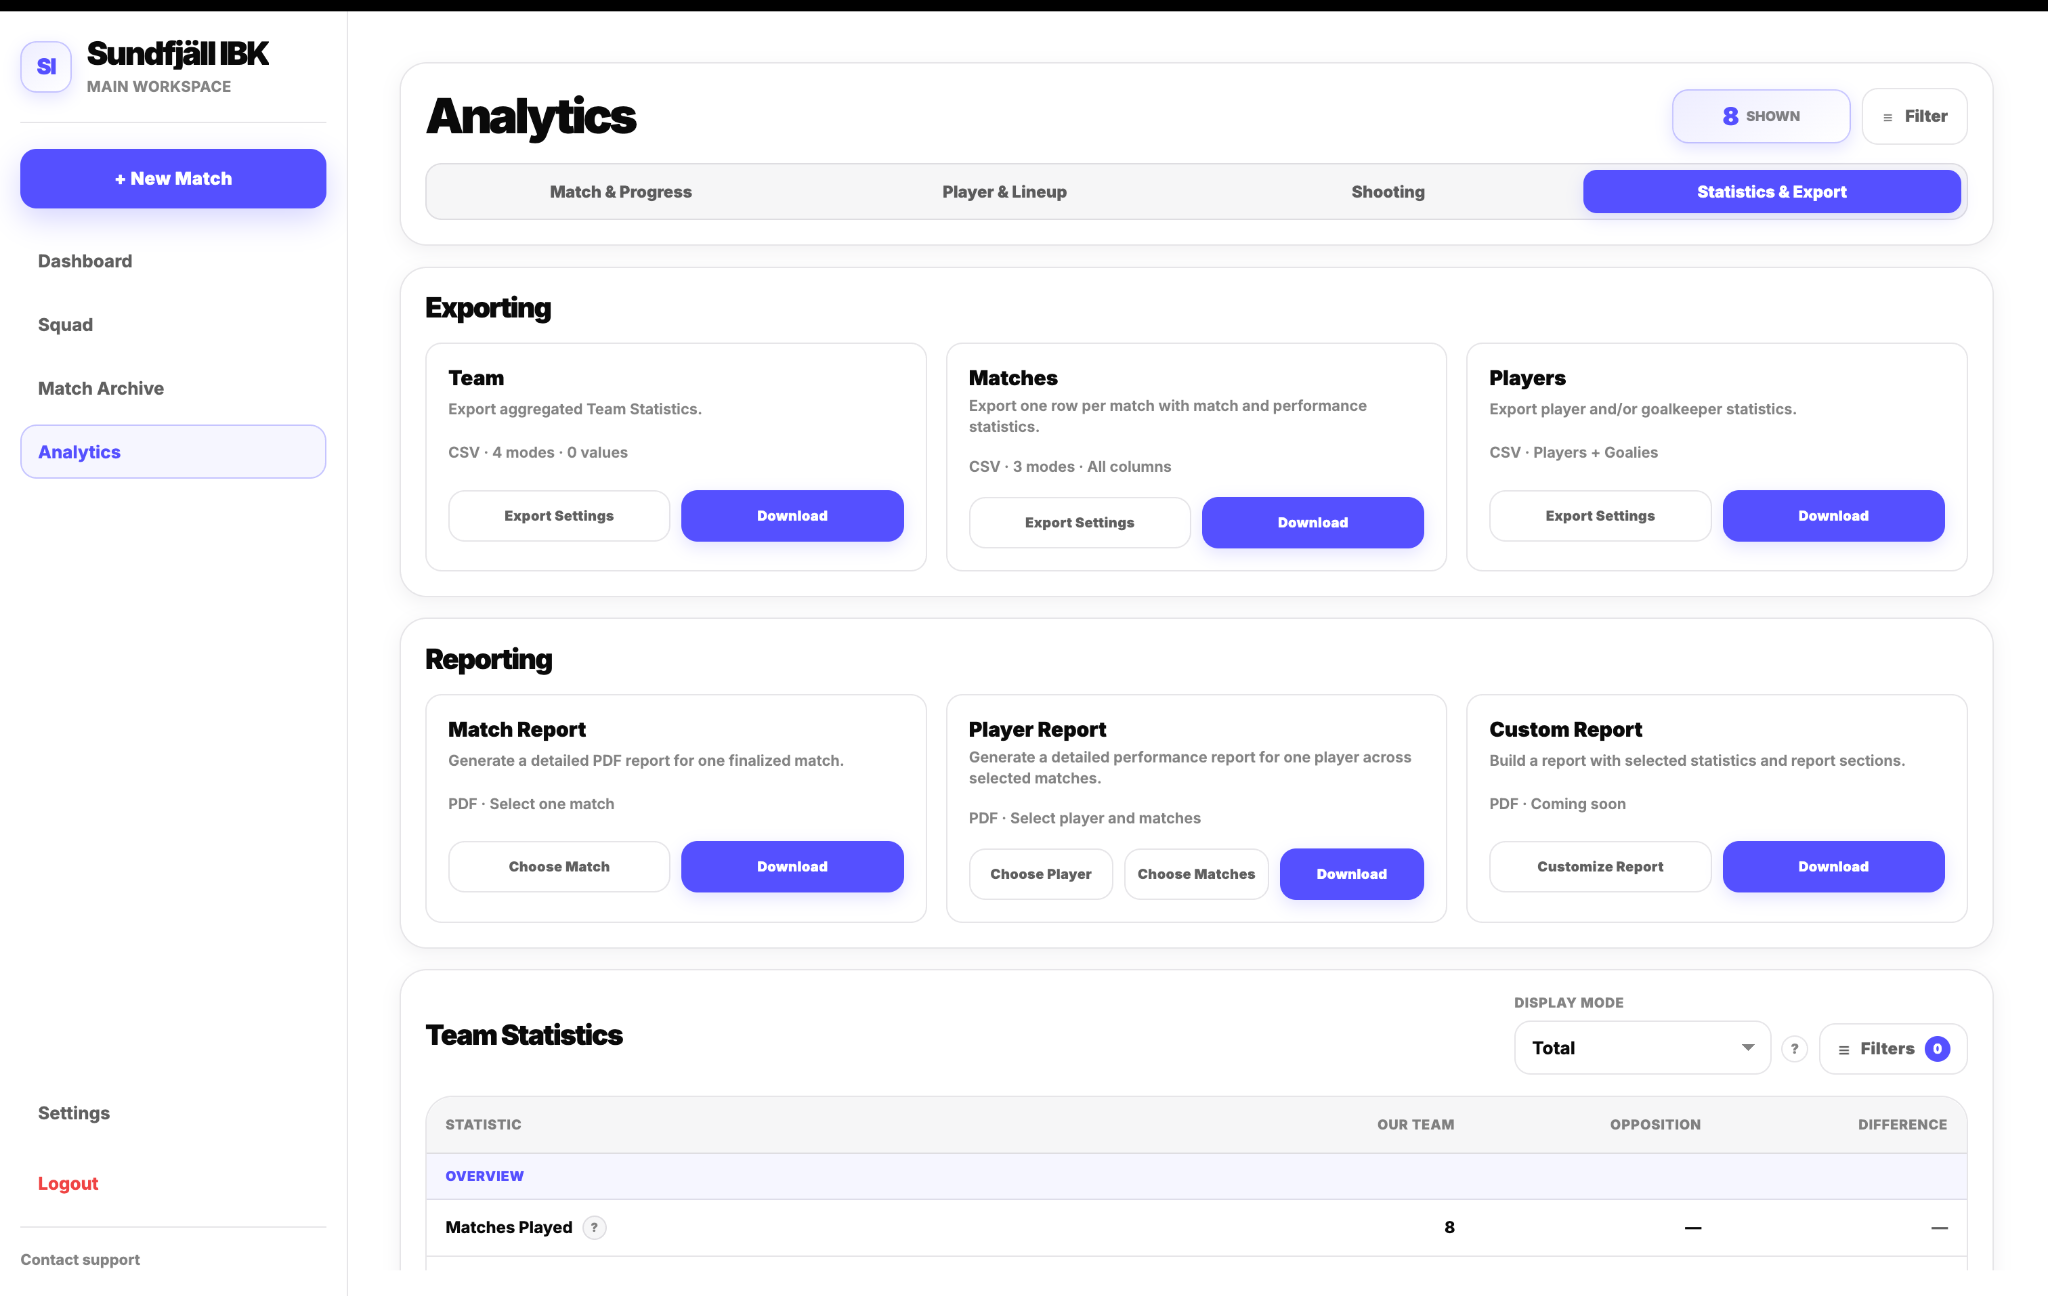
Reporting is one of the most important additions in Analytics 2.0 and a foundation we plan to build on further. Instead of requiring staff to manually turn tables and charts into something shareable, FloorballStats can now generate prepared PDF reports directly from tracked data.
Match Report creates a detailed review for one finalized match. Player Report creates a focused performance report for one player across a selected match sample. Both are designed to be usable directly with coaching staff or players.
Automatic Match Reports can be enabled in Settings and sent to a selected email after the match is ended. A detailed review can therefore reach the staff workflow within about five minutes, reducing manual work and shortening the feedback loop while the match is still fresh.
Reporting will continue to grow as a core part of the FloorballStats workflow: not only analysing what happened, but making the result immediately usable for communication, review and player development.
For a complete walkthrough of every panel, open the updated Analytics guide.